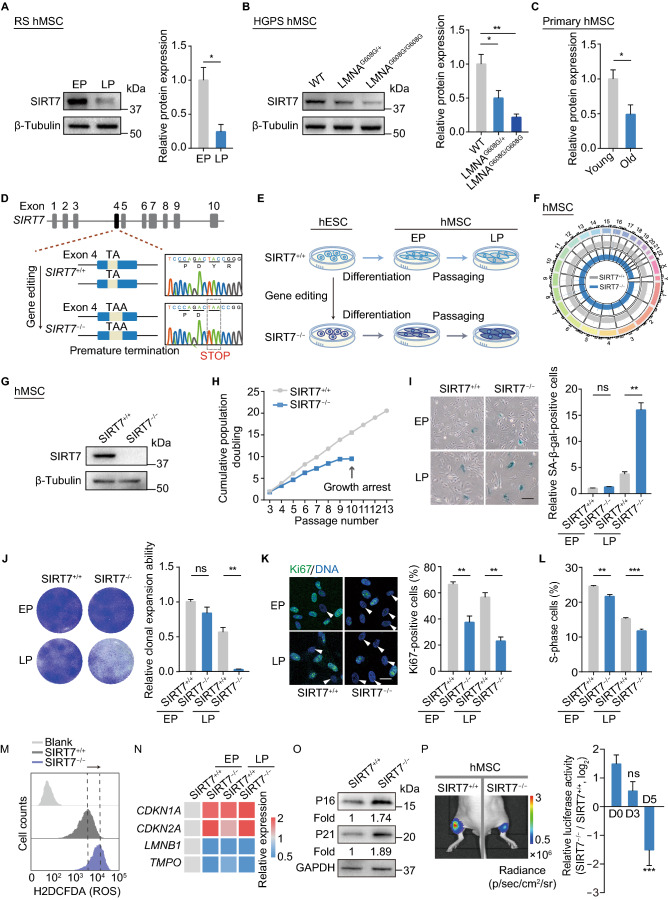
Figure 1.
Generation and characterization of SIRT7-deficient hESCs. (A) Left, Western blot analysis of SIRT7 protein in replicatively senescent (RS) hMSCs at early (EP, P3) and late passages (LP, P8) with β-Tubulin as loading control. Right, statistical analysis of relative SIRT7 protein expression levels. Data are presented as the means ± SEM. n = 3. *, P < 0.05 (t test). (B) Left, Western blot analysis of SIRT7 protein in WT and HGPS-specific (LMNAG608G/+ or LMNAG608G/G608G) hMSCs at LP (P8) with β-Tubulin used as loading control. Right, statistical analysis of relative SIRT7 protein expression levels. Data are presented as the means ± SEM. n = 3. *, P < 0.05, **, P < 0.01 (t test). (C) Statistical analysis of relative SIRT7 protein expression levels in young and old primary hMSCs. Data are presented as the means ± SEM. n = 4 samples. *, P < 0.05 (t test). (D) Left, schematic illustration of SIRT7 gene editing (exon 4) using CRISPR/Cas9-mediated non-homologous end joining (NHEJ) in hESCs. Right, DNA sequence chromatogram showing the introduction of termination codon TAA by gene editing. (E) Schematic workflow showing the generation of SIRT7+/+ and SIRT7−/− hMSCs from hESCs. (F) Genome-wide analysis of copy number variations (CNVs) in SIRT7+/+ and SIRT7−/− hMSCs at middle passage (MP, P6). (G) Western blot analysis of SIRT7 protein in SIRT7+/+ and SIRT7−/− hMSCs with β-Tubulin used as loading control. (H) Growth curves of SIRT7+/+ and SIRT7−/− hMSCs. Data are presented as the means ± SEM. n = 3. (I) SA-β-gal staining of SIRT7+/+ and SIRT7−/− hMSCs at EP (P3) and LP (P8). Scale bar, 125 μm. Data are presented as the means ± SEM. n = 3. ns, not significant, **, P < 0.01 (t test). (J) Clonal expansion analysis of SIRT7+/+ and SIRT7−/− hMSCs at EP (P3) and LP (P8). Data are presented as the means ± SEM. n = 3. ns, not significant, **, P < 0.01 (t test). (K) Immunostaining of Ki67 in SIRT7+/+ and SIRT7−/− hMSCs at EP (P3) and LP (P8). Scale bar, 25 μm. Data are presented as the means ± SEM. n = 3. **, P < 0.01 (t test). (L) Bar plot showing the percentages of cells in S-phase of cell cycle in SIRT7+/+ and SIRT7−/− hMSCs at EP (P3) and LP (P8). Data are presented as the means ± SEM. n = 3. **, P < 0.01, ***, P < 0.001 (t test). (M) ROS levels were determined by staining with the free radical sensor H2DCFDA and measured by FACS in SIRT7+/+ and SIRT7−/− hMSCs at MP (P6). Data are presented as the means ± SEM. n = 3. (N) Heatmap showing quantitative RT-PCR analysis of aging-related genes in SIRT7+/+ and SIRT7−/− hMSCs at EP (P3) and LP (P8) hMSCs. Expression levels of the indicated genes in each cell type were normalized to those in SIRT7+/+ hMSCs at EP (P3). (O) Western blot analysis of cyclin-dependent kinase inhibitors P16 and P21 proteins in SIRT7+/+ and SIRT7−/− hMSCs at MP (P6) with GAPDH used as loading control. (P) Analysis of luciferase activities in TA muscles of immunodeficient mice transplanted with SIRT7+/+ (left) or SIRT7−/− hMSCs (right) at MP (P6) in Day 0, 3 and 5 after implantation. Data calculated by the ratios of log2 (SIRT7−/−/SIRT7+/+) are presented as the means ± SEM. n = 6. ns, not significant, ***, P < 0.001 (t test)

