Figure 2.
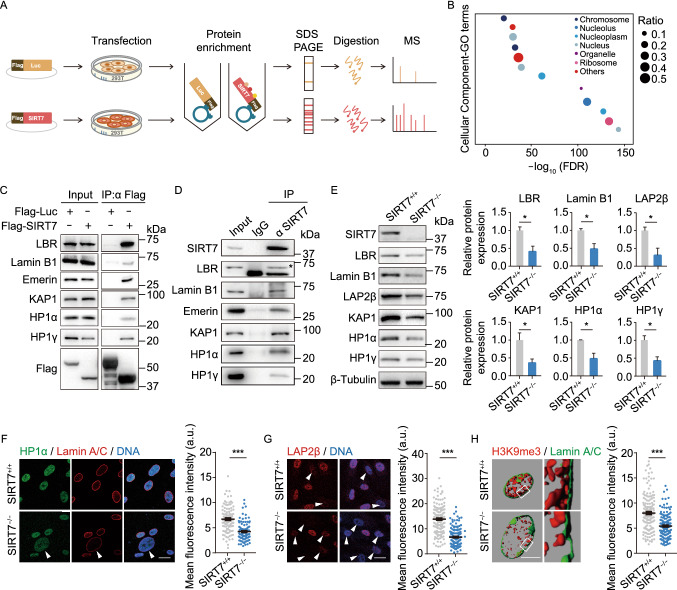
SIRT7 interacts with nuclear lamina proteins and heterochromatin proteins. (A) Schematic of mass spectrometry work flow for identifying SIRT7-interacting proteins. Luc was used as control. (B) Gene Ontology Cellular Component (GO-CC) enrichment analysis of candidate SIRT7-interacting proteins identified by mass spectrometry. (C) Co-immunoprecipitation analysis of LBR, Lamin B1, Emerin, KAP1, HP1α and HP1γ with exogenous Flag-tagged SIRT7 protein in HEK293T cells. (D) Co-immunoprecipitation analysis of LBR, Lamin B1, Emerin, KAP1, HP1α and HP1γ with endogenous SIRT7 protein in WT hMSCs. The band corresponding to LBR is indicated with an asterisk. (E) Left, Western blot analysis of heterochromatin-related proteins in hMSCs at MP (P6) with β-Tubulin used as loading control. Right, statistical analysis of the relative heterochromatin-related protein expression levels. Data are presented as the means ± SEM. n = 3. *, P < 0.05 (t test). (F) Left, immunostaining of HP1α and Lamin A/C in SIRT7+/+ and SIRT7−/− hMSCs at MP (P6). White arrowheads indicate cells with decreased expression of HP1α. Right, mean fluorescence intensity of HP1α was measured by Image J. Scale bar, 25 μm. Data are presented as the means ± SEM. n = 100 cells. ***, P < 0.001 (t test). (G) Left, immunostaining of LAP2β in SIRT7+/+ and SIRT7−/− hMSCs. White arrowheads indicate cells with decreased expression of LAP2β. Right, mean fluorescence intensity of LAP2β was measured by Image J. Scale bar, 25 μm. Data are presented as the means ± SEM. n = 150 cells. ***, P < 0.001 (t test). (H) Left, z-stack 3D reconstruction of H3K9me3 and Lamin A/C immunofluorescence images (shown in Fig. S3B) in SIRT7+/+ and SIRT7−/− hMSCs at MP (P6). Scale bar, 5 μm. Right, mean fluorescence intensity of H3K9me3 in Fig. S3B was quantified with Image J. Data are presented as means ± SEM. n = 150 cells. ***, P < 0. 001 (t test)

