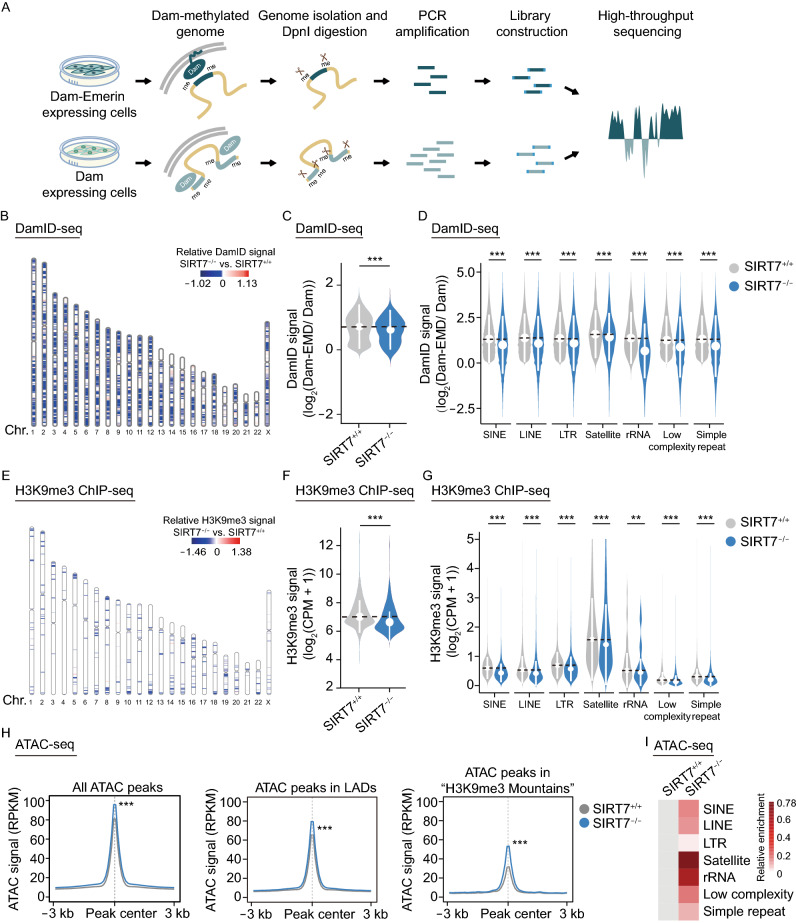
Figure 3.
SIRT7 is required for heterochromatin maintenance in hMSCs. (A) Schematic diagram showing the strategy for DamID-seq library construction. When the Dam-Emerin fused protein was expressed in hMSCs, the genomic DNA region near the nuclear envelope could be methylated by DNA adenine methyltransferase (Dam) at adenines. A parallel experiment “Dam only” was used to eliminate the background Dam signal. After genome extraction, the sequence containing methylated sites could be specifically cut by DpnI and amplified by PCR. The amplified fragments were then proceeded to DNA library construction and high-throughput sequencing. (B) Chromosome ideogram showing relative DamID signals in LADs across 23 chromosomes at MP (P6). The color key from blue to red shows low to high relative DamID levels, respectively. (C) Violin plot showing the DamID signal [log2 (Dam-EMD/Dam)] in LADs in SIRT7+/+ and SIRT7−/− hMSCs at MP (P6). The white circles represent the median values, and the white lines represent the values within the IQR from smallest to largest. ***, P < 0.001 (Two-sided Wilcoxon rank-sum test). (D) Violin plot showing the DamID signal [log2 (Dam-EMD/ Dam)] in LADs located in repetitive elements, including SINE, LINE, LTR, Satellite, rRNA, low complexity and simple repeat elements, in SIRT7+/+ and SIRT7−/− hMSCs at MP (P6). The white circles represent the median values, and the white lines represent the values within the IQR from smallest to largest. ***, P < 0.001 (Two-sided Wilcoxon rank-sum test). (E) Chromosome ideogram showing the relative H3K9me3 signal in “H3K9me3 mountains” across 23 chromosomes at MP (P6). The color key from blue to red shows low to high relative H3K9me3 levels, respectively. (F) Violin plot showing the H3K9me3 signal in “H3K9me3 mountains” in SIRT7+/+ and SIRT7−/− hMSCs at MP (P6). The white circles represent median values, and the white lines represent the values within the IQR from smallest to largest. ***, P < 0.001 (Two-sided Wilcoxon rank-sum test). (G) Violin plot showing the H3K9me3 signal in “H3K9me3 mountains” located in repetitive elements, including SINE, LINE, LTR, Satellite, rRNA, low complexity and simple repeat elements in SIRT7+/+ and SIRT7−/− hMSCs at MP (P6). The white circles represent the median values, and the white lines represent the values within the IQR from smallest to largest. **, P < 0.01, ***, P < 0.001 (Two-sided Wilcoxon rank-sum test). (H) Metaplots showing the average ATAC signals for all ATAC peaks, ATAC peaks in LADs, and ATAC peaks in “H3K9me3 mountains” in SIRT7+/+ and SIRT7−/− hMSCs at MP (P6). ***, P < 0.001 (Two-sided Wilcoxon rank-sum test). (I) Heatmap showing the relative enrichment of ATAC peaks in repetitive elements, including SINE, LINE, LTR, Satellite, rRNA, low complexity and simple repeat elements in SIRT7+/+ and SIRT7−/− hMSCs at MP (P6). Enrichment of ATAC peaks in repetitive elements in SIRT7−/− hMSCs were normalized to those in SIRT7+/+ hMSCs

