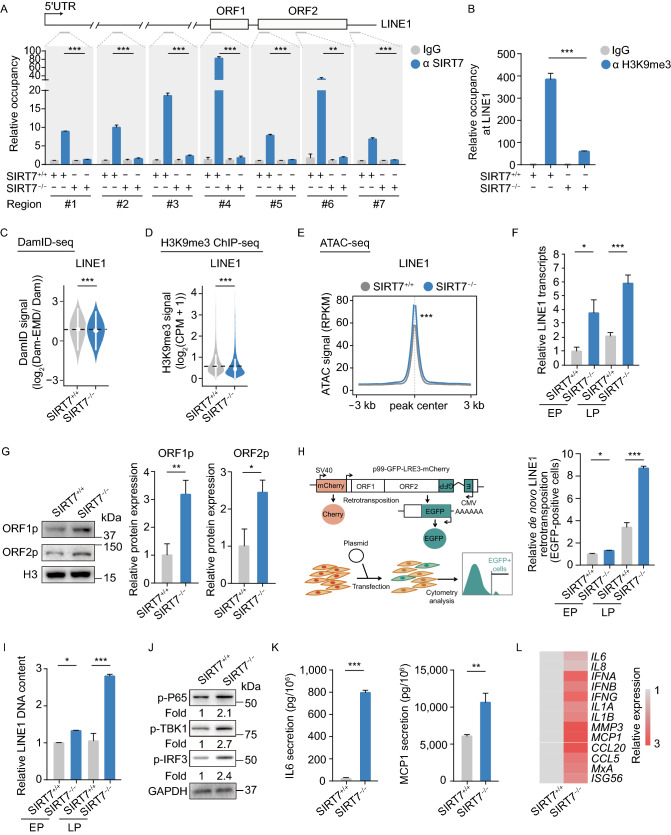
Figure 4.
Depletion of SIRT7 in hMSCs induces LINE1 activation and triggers innate immune responses via cGAS-STING pathway. (A) ChIP-qPCR assessment of SIRT7 enrichment at seven LINE1 regions in SIRT7+/+ and SIRT7−/− hMSCs at MP (P6). Data are presented as the means ± SEM. n = 3. **, P < 0.01. ***, P < 0.001 (t test). (B) ChIP-qPCR assessment of H3K9me3 enrichment of LINE1 regions in SIRT7+/+ and SIRT7−/− hMSCs at MP (P6) using the fourth LINE1 primer. Data are presented as the means ± SEM. n = 4. ***, P < 0.001 (t test). (C) Violin plot showing the DamID signal [log2 (Dam-EMD/ Dam)] in LINE1 regions located in LADs in SIRT7+/+ and SIRT7−/− hMSCs at MP (P6). The white circles represent the median values, and the white lines represent the values within the IQR from smallest to largest. ***, P < 0.001 (Two-sided Wilcoxon rank-sum test). (D) Violin plot showing the H3K9me3 signal in LINE1 regions located in “H3K9me3 mountains” in SIRT7+/+ and SIRT7−/− hMSCs at MP (P6). The white circles represent the median values, and the white lines represent the values within the IQR from smallest to largest. ***, P < 0.001 (Two-sided Wilcoxon rank-sum test). (E) Metaplot showing the average ATAC signal for ATAC peaks in LINE1 regions in SIRT7+/+ and SIRT7−/− hMSCs at MP (P6). ***, P < 0.001 (Two-sided Wilcoxon rank-sum test). (F) Quantitative RT-PCR analysis of LINE1 transcript levels in SIRT7+/+ and SIRT7−/− hMSCs at EP (P3) and LP (P8). Data are presented as the means ± SEM. n = 4. *, P < 0.05. ***, P < 0.001 (t test). (G) Left, Western blot analysis of LINE1 ORF1 and ORF2 proteins in SIRT7+/+ and SIRT7−/− hMSCs at MP (P6) with H3 used as loading control. Right, statistical analysis of relative ORF1 and ORF2 protein expression levels. Data are presented as the means ± SEM. n = 3. *, P < 0.05, **, P < 0.01 (t test). (H) Left, schematic of retrotransposition assay. The plasmid p99-GFP-LRE3-Cherry lacking a CMV promoter encodes a full-length LINE1 element tagged with an indicator cassette of mEGFP1 retrotransposition and mCherry cassette. Right, quantification of de novo retrotransposition events (EGFP-positive cells) in SIRT7+/+ and SIRT7−/− hMSCs at MP (P6), normalized by live cell numbers and transfection efficiency. Data are presented as the means ± SEM. n = 3. *, P < 0.05. ***, P < 0.001 (t test). (I) RT-qPCR analysis of the relative LINE1 genomic DNA content in SIRT7+/+ and SIRT7−/− hMSCs at EP (P3) and LP (P8). Data are presented as the means ± SEM. n = 4. *, P < 0.05. ***, P < 0.001 (t test). (J) Western blot analysis of the phosphorylation levels of P65, TBK1 and IRF3 in SIRT7+/+ and SIRT7−/− hMSCs at MP (P6) with GAPDH used as loading control. (K) ELISA analysis of IL6 and MCP1 levels in culture medium of SIRT7+/+ and SIRT7−/− hMSCs at MP (P6). IL6 levels were normalized to cell number. Data are presented as the means ± SEM. n = 5. MCP1 levels were normalized to cell number. n = 3. **, P < 0.001. ***, P < 0.001 (t test). (L) Heatmap showing quantitative RT-PCR analysis of IFN-I and SASP genes in SIRT7+/+ and SIRT7−/− hMSCs at MP (P6). Expression levels of these indicated genes in SIRT7−/− hMSCs were normalized to those in SIRT7+/+ hMSCs

