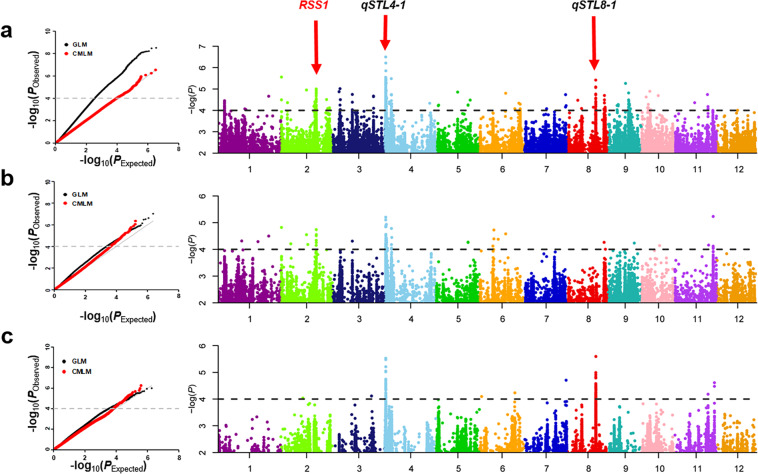
Figure 2.
GWAS for salt tolerance in rice seedlings. Quantile–quantile plots and Manhattan plots for the GWAS in the full (a), indica (b) and japonica (c) populations using CMLM. In quantile-quantile plots, black dots are for GLM, and red points are for CMLM. In Manhattan plots, the gene in red was previously cloned, and QTLs in black were considered to be important. Dashed horizontal line for each population indicates the suggestive threshold (P = 1.0 × 10⁻⁴).

