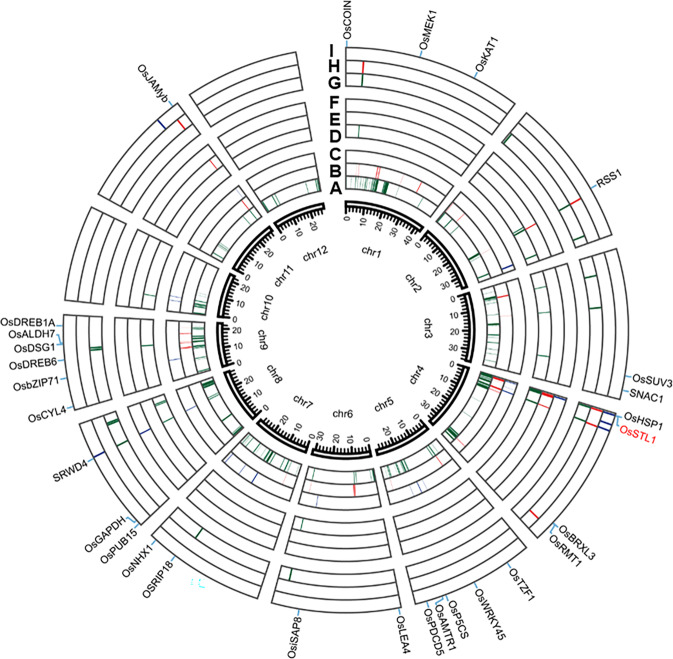
Figure 3.
Circos map of all association signals for salt tolerance in the full population, indica and japonica using GLM, CMLM and FaST-LMM. The colored blocks in each layer from inner to outer represent QTLs detected from in the full population (a), indica subpopulation (b), japonica subpopulation (c) using GLM, and in the same populations (d,e,f) using CMLM and (g,h,i) using FaST-LMM, respectively. Twenty-eight known genes are labeled with black script at the outermost layer; red color represents candidate genes detected in this study.

