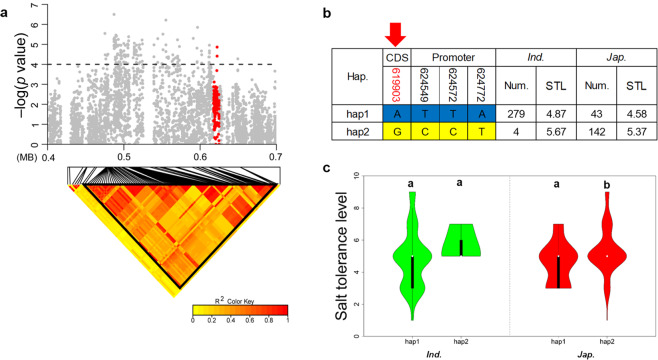
Figure 4.
Dissection of OsSTL1 for salt tolerance on chromosome 4. (a) Local Manhattan plot (upper) and LD heatmap (lower) surrounding the lead SNP for STL on chromosome 4. Red dots represent all SNPs within OsSTL1. (b) Different haplotypes of OsSTL1 in indica and japonica. The red number identifies the nonsynonymous mutation; red arrow shows the functional site. (c) Comparison of the STL trait for salt tolerance among OsSTL1 haplotypes in indica and japonica using one-way ANOVA. Green violins represent indica and red violins represent japonica. Different letters indicate significant differences (p < 0.01) detected by one-way ANOVA.

