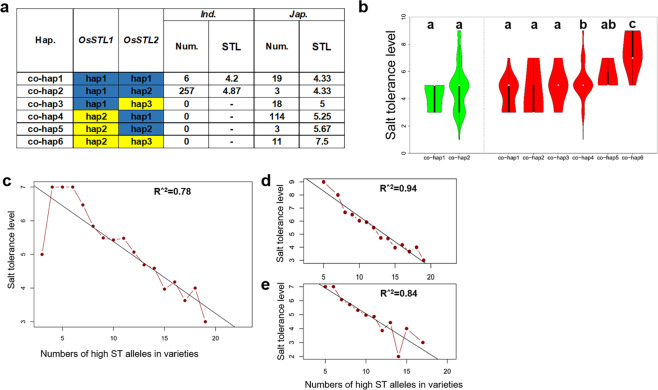
Figure 6.
Functional validation of haplotype combinations of OsSTL1 and OsSTL2. (a) STL for different haplotype combinations of OsSTL1 and OsSTL2. Blue color represents superior alleles and yellow color represents inferior alleles. (b) Comparison of the STL trait for salt tolerance among haplotype combinations of OsSTL1 and OsSTL2 in indica and japonica using one-way ANOVA. Green violins represent indica and red violins represent japonica. Different letters indicate significant differences (p < 0.05) detected by one-way ANOVA. Pyramiding of lead SNP of high salt tolerance alleles in the full population (c), indica (d) and japonica (e).

