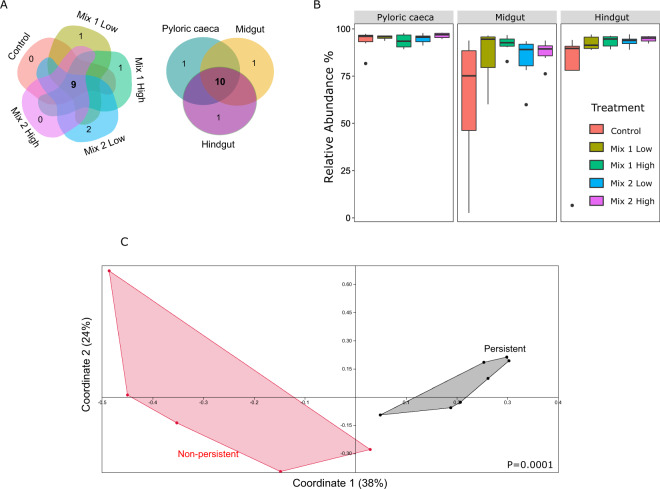
Figure 5.
(A) The persistent microbiome is shared between treatments (left) and gut parts (right), as indicated by the Venn diagram. (B) The relative abundance of the persistent microbiome overall consisted of around 60% of the overall abundance, while it increased with antibiotic resistance, especially observed in the midgut and hindgut. (C) Principal Coordinate Analysis based on Jaccard metric on the antibiotic genes’ richness between the persistent and the affected (non-persistent) microbes. P-value (P = 0.0001) indicates significance based on Permanova (Jaccard metric).

