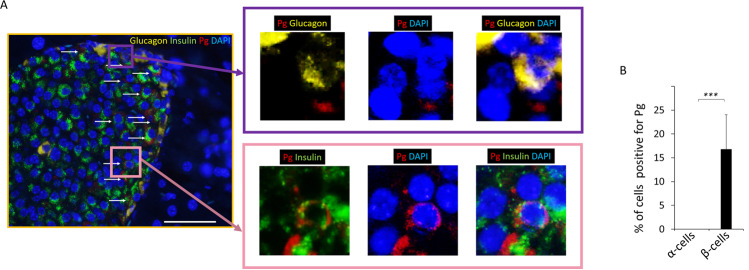
Figure 2.
Pg is localized in β- but not in α-cells in experimental animals. (A) Representative image from IF microscopy and higher magnification of insets showing Pg, glucagon, and nuclear stain (top panels) and Pg, insulin and nuclear staining (bottom panels). Yellow: glucagon, Green: insulin, Red: Pg, Blue: nuclei. White arrows point to Pg in low magnification image. Scale bar represents 50μm. For separate channel images of 40×, see Fig. S1. (B) Results from counting cells positive for Pg/gingipain. The total number of insulin+ cells and insulin+/Pg+ cells were counted per islet and the percentage of insulin+ cells that were positive for Pg were calculated (5 islets /mouse, N = 5 mice/group). Data show mean + S.D. There were no glucagon+ cells containing Pg. The difference in the percentage of α- vs. β-cells containing Pg is statistically significant (***p < 0.001).

