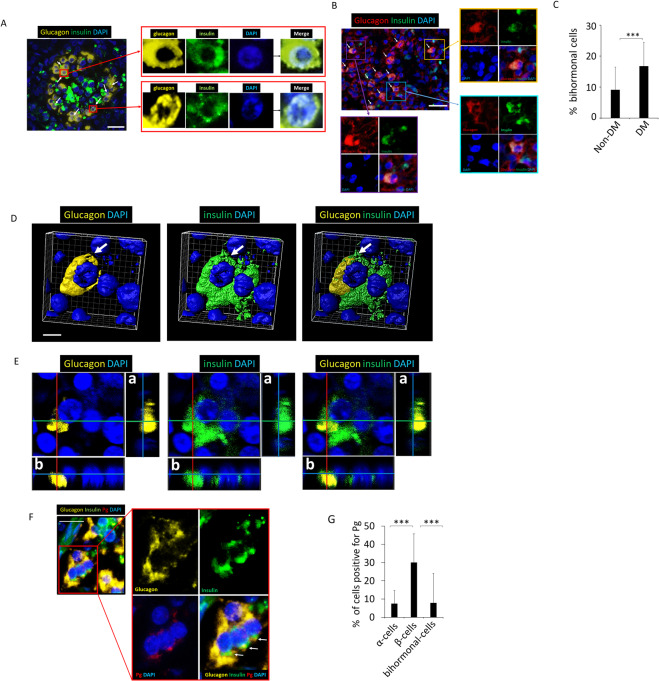
Figure 7.
Bihormonal cells are detected in human pancreata from Non-DM and DM subjects. Pg is present in β-cells and in a low % of α-cells as well as bihormonal cells. (A) Representative result from IF microscopy showing the presence of bihormonal cells in human (Non-DM) post-mortem samples. White arrows indicate bihormonal cells. Scale bar represents 25 μm. Insets show glucagon+, insulin+, DAPI stained and merged images. Yellow: glucagon, Green: insulin, Blue: nuclei. Representative of N = 13 Non-DM samples. For separate channel images of 40×, see Fig. S4. (B) Bihormonal cells detected in pancreata of human DM subjects. White arrows point to bihormonal cells. Insets show glucagon+, insulin+, DAPI stained and merged images. Red: glucagon, Green: insulin, Blue: nuclei. Representative of N = 12. Scale bar represents 25 μm. (C) The percentage of bihormonal cells is significantly higher in DM compared with Non-DM subjects (***p < 0.001). % bihormonal cells was determined by counting the number of cells positive for insulin and glucagon divided by the number of cells positive for glucagon. A total of 429 and 469 α-cells were counted in Non-DM and DM subjects respectively. Two fields of 400 × 300 μm rectangle area were counted per subject. Data show means ± S.D. (D) 3-D images from confocal microscopy of glucagon+, insulin+ bihormonal cells (white arrows). Scale bar represents 5 μm. (E) Orthogonal analysis of bihormonal cell shown in (D). a & b represent orthogonal projections. Yellow: glucagon, Green: insulin, Blue: nuclei. (F) Representative image of bihormonal cells positive for Pg/gingipain. Yellow: glucagon, Green: insulin, Red: Pg/gingipain, Blue: nuclei. (G) Percentage of Pg positive α-, β- and bihormonal cells. Y-axis: % cells positive for Pg, X-axis: cell types. 347 α-cells, 444 β-cells and 51 bihormonal cells were counted. N = 5 DM subjects. Data are presented as mean + S.D. ***p < 0.001.

