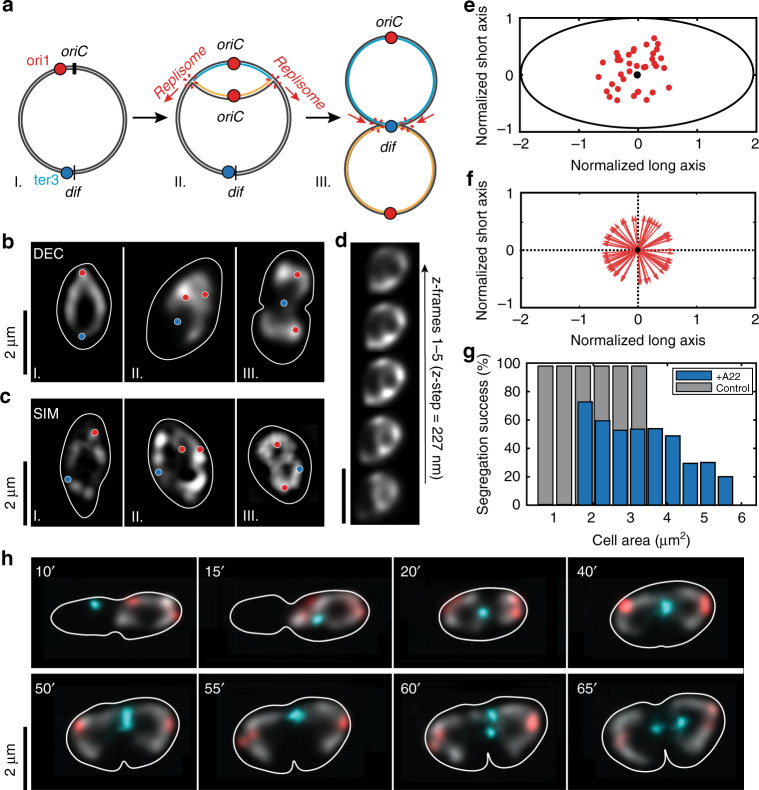
Fig. 4. Time lapse images of expanded replicating cells with Ori, Ter and chromosome labels.
a Schematics depicting: I: labels on the circular chromosome, II: the formation of replication bubble, and III: figure-8 shapes by two replicated circular chromosomes that are still connected at the ter region near the dif site. b, c Deconvolved/2D SIM microscopy images of replicating cells depicting the same three shapes (circular chromosome, replication bubble and figure-8 shape) similar to the stages in the schematics shown in a. The circular chromosome is shown in greyscale, and ori1 and ter3 foci with red and cyan spots, respectively. The cell contour is shown as continuous white lines. d Deconvolved images of replication bubble in various height planes across the focal plane at the middle of the stack (z-step 227 nm). Scale bar 2 μm e Splitting positions of the Ori relative to the normalized cell size. The Ori focus preferentially splits near the geometric center (black circle) of the cells (N = 38). f After splitting, the Ori’s move away from their splitting site in a random direction, without any preferential polar orientation as shown by point vectors emerging from the geometric center (black circle) depicting the Ori directionality (N = 80). g Successful chromosome segregation depends on the cell area at the start of replication, for rod-shaped (grey bars, N = 139) and A22 treated cells (blue bars, N = 371). h Time lapse images of replicating cells. The circular chromosome is shown in greyscale, Ori and Ter foci with red and cyan color, respectively. The cell contour is shown as continuous white line. The 10–20′ data show that the ter region moves towards the cell center where the future septum will form (t = 40′). The ter focus stays localized near the septum, until it duplicates (t = 60′) whereupon it quickly segregates to the sister halves (t = 65′).

