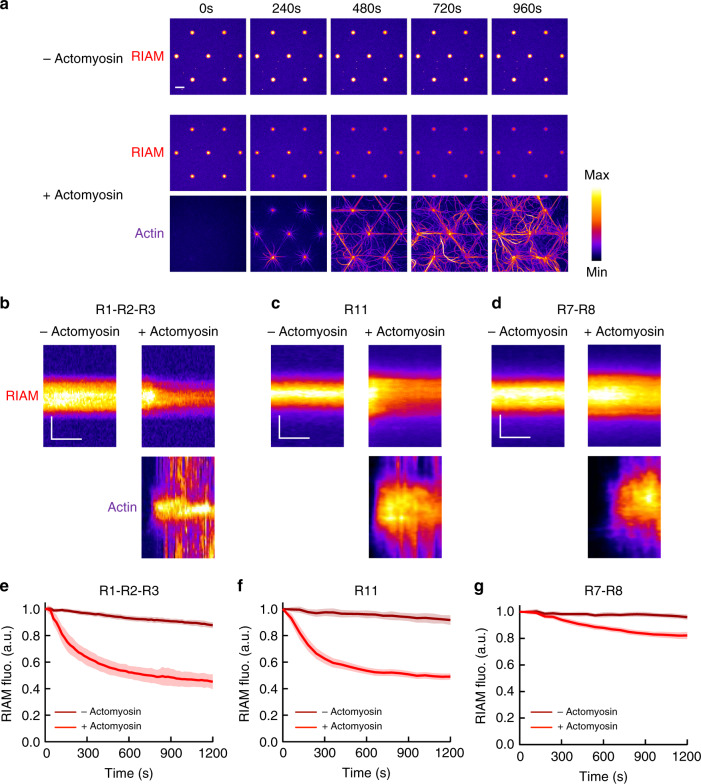
Fig. 3. The actomyosin force provokes RIAM dissociation from several talin domains.
a Time lapses showing the binding of RIAM 1-306 to talin R1–R2–R3-coated disks in the absence (top) or presence of actomyosin (RIAM is shown on the middle and actin on the bottom panel). This experiment was repeated 11 times independently with the same results. b–d Kymographs of mCherry-RIAM 1-306 (top) and actin (bottom) along a cross-section of a disk coated with talin R1–R2–R3 (b) R11 (c) or R7–R8 (d) in the absence (left) or presence (right) of actomyosin. For better comparison, the fluorescence of mCherry-RIAM 1-306 in kymographs was normalized as the maximal fluorescence in the R11- and R7–R8-coated disks. Conditions: 100 nM mCherry-RIAM 1-306, 2.4 µM actin (1% Alexa647-labeled for R1–R2–R3, 2% Alexa488 for R11 and R7–R8), 50 nM myosin, 1 µM talin during the coating step. The images are color coded using the fire LUT of ImageJ. Scale bar in time lapses = 10 µm. In kymographs, horizontal bar = 500 s, vertical bar = 5 µm. e–g Kinetics of the mean fluorescence of mCherry-RIAM 1-306 corresponding to the conditions described in (b–d). Data are mean ± SD. e n = 63 (−actomyosin), n = 62 disks (+actomyosin). f n = 50 (−actomyosin), n = 60 disks (+actomyosin). g n = 49 (−actomyosin), n = 60 disks (+actomyosin). Data were first normalized to 1 as the maximal mCherry-RIAM 1-306 fluorescence and synchronized using this maximal value as t0 before being averaged. Source data are provided as a Source data file. See Supplementary Movie 4, Supplementary Movie 5, and Supplementary Movie 6.

