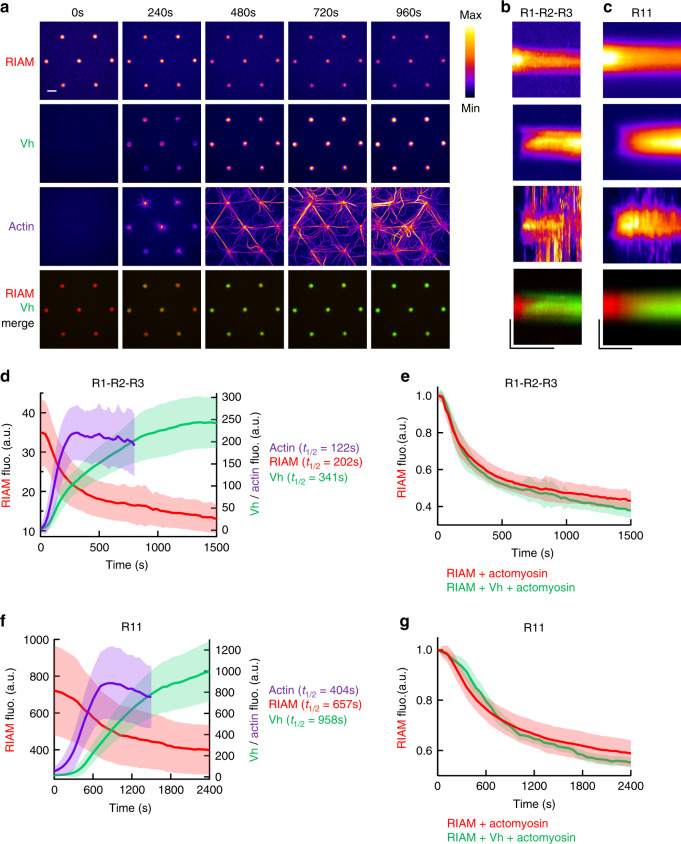
Fig. 4. The actomyosin force provokes the sequential exchange of RIAM for vinculin on talin.
a Time lapses showing the concomitant dissociation of RIAM 1-306, association of Vh, accumulation of actomyosin, and a Vh/RIAM merge in the same disks coated with talin R1–R2–R3. This experiment was repeated 4 times independently with the same results. b, c From top to bottom: kymographs of RIAM, Vh, actin, and Vh/RIAM merge along the cross-section of a disk coated with talin R1–R2–R3 (b) or R11 (c). Conditions: 100 nM mCherry-RIAM, 100 nM EGFP-Vh, 2.4 µM actin (1% Alexa647-labeled), 50 nM myosin, and 1 µM talin during the coating step. The images are color coded using the fire LUT of ImageJ. Scale bar in time lapses = 10 µm. In kymographs, horizontal bar = 1000 s, vertical bar = 5 µm. d, f Kinetics of the mean fluorescence of mCherry-RIAM 1-306, EGFP-Vh and Alexa647-labeled actin in disks coated with talin R1–R2–R3 (d) and R11 (f) corresponding to the conditions described in (b) and (c). Actin fluorescence is multiplied by 3. Data are mean ± SD. n = 63 (d), n = 59 disks (f). e Kinetics of mCherry-RIAM 1-306 dissociation from disks coated with talin R1–R2–R3 in the presence of actomyosin with or without 100 nM EGFP-Vh as described in Fig. 3b and b respectively. n = 62 (RIAM + actomyosin), n = 63 disks (RIAM + Vh + actomyosin). g Kinetics of mCherry-RIAM 1-306 dissociation from disks coated with talin R11 in the presence of actomyosin with or without 100 nM EGFP-Vh as described in Fig. 3c and c respectively. n = 59 disks. e, g Data are mean ± SD. Data were first normalized to 1 as the maximal mCherry-RIAM 1-306 fluorescence and synchronized using this maximal value as t0 before being averaged. Source data are provided as a Source data file. See Supplementary Movie 7 and Supplementary Movie 8.

