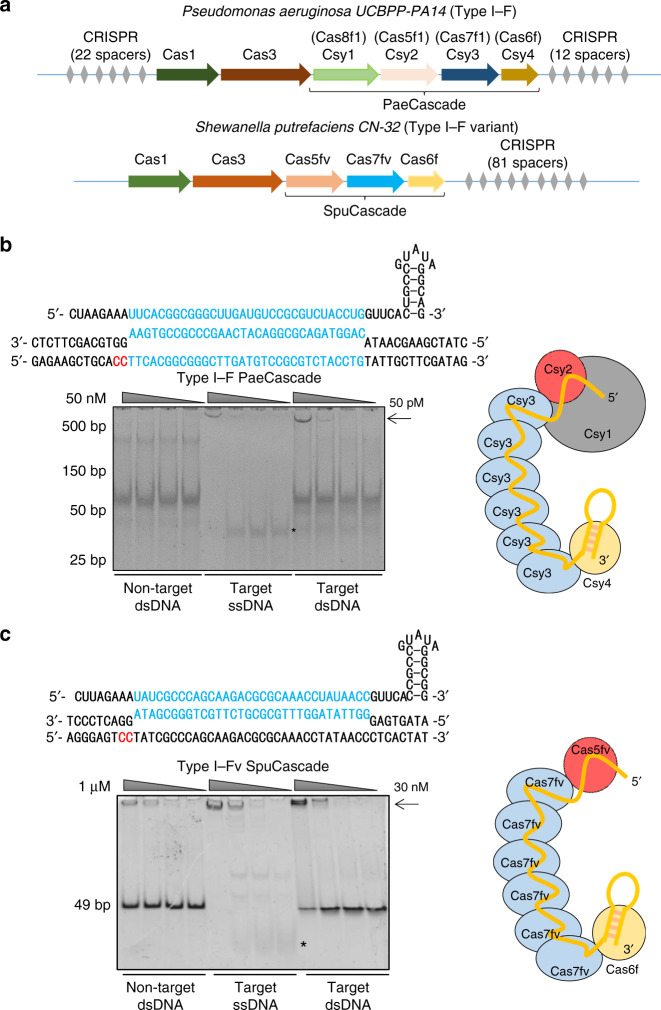
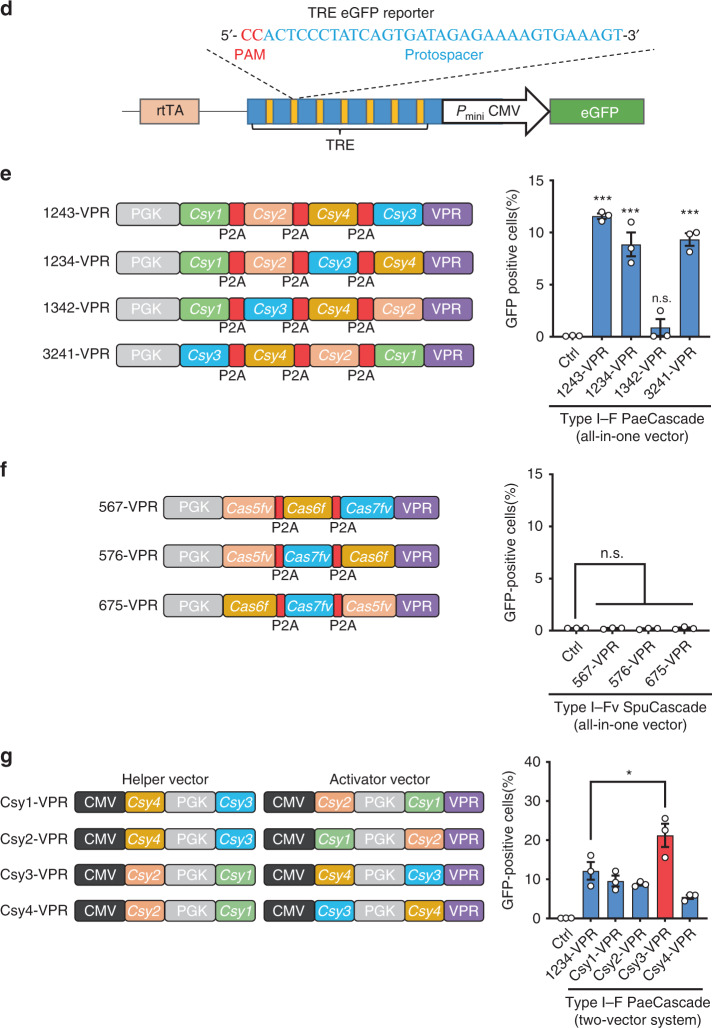
Fig. 1. Targeted transcription activation by type I–F PaeCascade.
a Schematic diagram of the Pseudomonas aeruginosa type I–F and Shewanella putrefaciens type I–Fv CRISPR–Cas locus. Cas proteins are presented with arrows in different colors. CRISPR repeats are indicated with gray diamonds. b Electrophoresis mobility shift assays to detect target DNA binding by PaeCascade. Up, schematic representation of the processed crRNA with 5′-CC-3′ PAM recognition and base pairing at the DNA target site. Down, the result of the EMSA assay. The arrow indicates PaeCascade–crRNA–DNA complex. “*” Indicates free ssDNA. c Electrophoresis mobility shift assays to detect target DNA binding by SpuCascade. Up, schematic representation of the processed crRNA with 5′-CC-3′ PAM recognition and base pairing at the DNA target site. Down, the result of the EMSA assay. The arrow indicates the SpuCascade–crRNA–DNA complex. “*” Indicates free ssDNA. d A schematic of the integrated sequence in the TRE-eGFP reporter cell. The target sequences of type I–F and type I–Fv CRISPR–Cas system containing a 5′-CC-3′ PAM is shown. PAM is in red, and the target sequence is in blue. rtTA: reverse tetracyclin-transactivator. TRE: tetracyclin response element. e Flow cytometric analysis of GFP activation in TRE-eGFP reporter cells transfected with type I–F PaeCascade all-in-one vectors and crRNA expression vectors. Left: the all-in-one constructs used in the experiment. PaeCascade subunits linked by self-cleaving P2A peptides was driven by PGK promoter. Right: Quantification of GFP positive cell induced by type I–F PaeCascade all-in-one vectors. f Flow cytometric analysis of GFP activation in TRE-eGFP reporter cells transfected with type I–F SpuCascade all-in-one vectors and crRNA expression vectors. g Flow cytometric analysis of GFP activation in TRE-eGFP reporter cells transfected with type I–F PaeCascade 2-vector systems and crRNA expression vectors. Left: 2-vector systems used in the experiments. Right: quantification of GFP positive cells induced by type I–F PaeCascade 2-vector systems. Ctrl: untransfected control. Data represented three biological repeats and displayed as mean ± S.E.M. Statistical significance was calculated using one-way ANOVA (n.s., not significant; *P < 0.05; ***P < 0.001). Source data are provided as a Source Data file.


