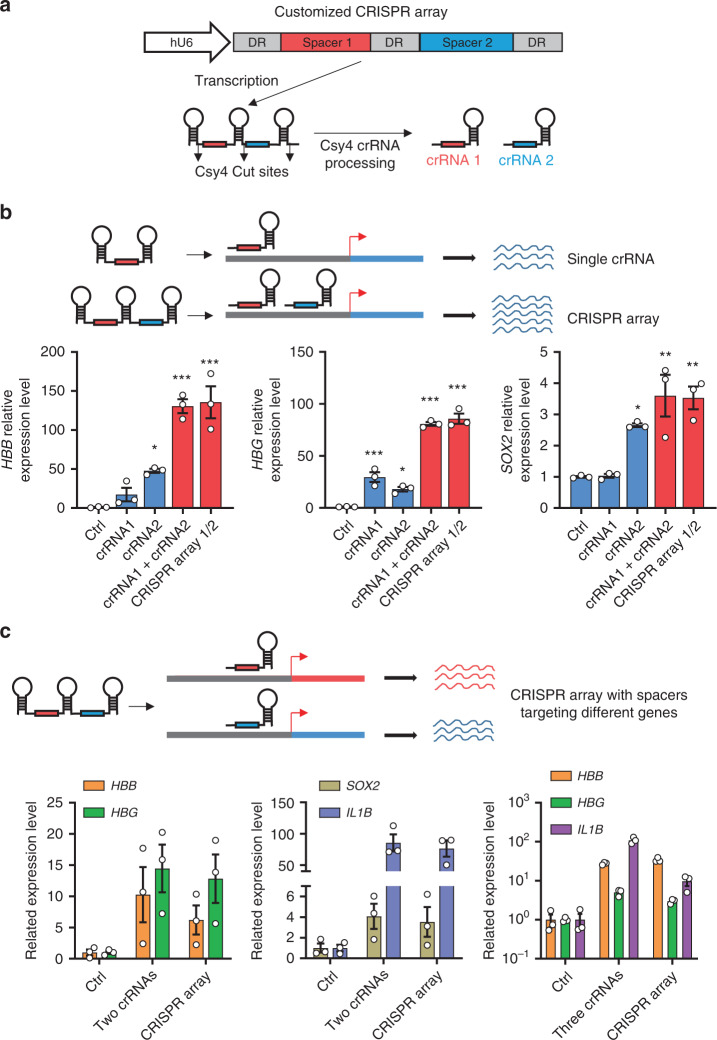
Fig. 5. Transcription activation with customized CRISPR arrays by type I–F PaeCascade.
a Schematic illustrating pre-crRNA processed by Csy4 in human cells. Tandem spacer containing premature crRNA (DR-spacer1-DR-spacer2-DR) was transcribed and processed by Csy4 into two mature crRNAs. White box: human U6 promoter (hU6); Gray box: direct repeats (DR); Red box: spacer 1; Blue box: spacer 2. b Quantitative PCR analysis of HBB, HBG and SOX2 transcription levels in HEK293T cells transfected with type I–F PaeCascade VPR (Csy3-VPR) with two crRNA expression vectors (crRNA1 + crRNA2) or customized CRISPR arrays (CRISPR arrays 1/2) targeting −100 bp (crRNA1) and −200 bp (crRNA2) upstream of TSS in Fig. 2. Upper: schematic illustration of Csy4 processing customized CRISPR arrays targeting two sites on the same gene. Lower: quantitative PCR analysis of HBB, HBG, and SOX2 transcription level in HEK293T cells. HEK293T cells were transfected with PaeCascade 2-vector systems (Csy3-VPR) and crRNA expression vectors as indicated. 48 h post-transfection, cells were lysed for RNA extraction and quantitative PCR assay. c Quantitative PCR analysis of multiplex gene activation in HEK293T cells transfected with type I–F PaeCascade VPR (Csy3-VPR) with 2 or 3 independent crRNA vectors or customized CRISPR arrays (CRISPR array) targeting different genes. Upper: Schematic illustration of Csy4 processing customized CRISPR arrays targeting two sites on different genes. Lower: quantitative PCR analysis of multiplex activating level in HEK293T cells. HEK293T cells were transfected with PaeCascade 2-vector systems (Csy3-VPR) and crRNA expression vectors as indicated. 2 crRNAs indicates two independent crRNA expression vectors. 3 crRNAs indicates three independent crRNA expression vectors. CRISPR array, customized CRISPR array in one vector. 48 h post-transfection, cells were lysed for RNA extraction and quantitative PCR assay. Ctrl: non-targeting crRNA control. Data represented three biological repeats and displayed as mean ± S.E.M. Statistical significance was calculated using one-way ANOVA (*P < 0.05; **P < 0.01; ***P < 0.001). Source data are provided as a Source Data file.

