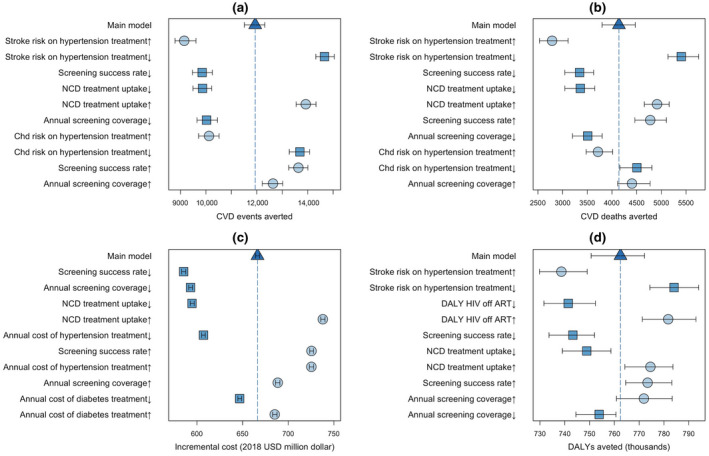
Figure 4.

One‐way sensitivity analysis to value of selected model parameters. Panels show the sensitivity of epidemiological outputs, including the number of CVD events (panel A) and deaths (panel B) averted, and costing outcomes, including the incremental cost of intervention (panel C) and DALYs averted (panel D), under one‐way variation in the value of selected model parameters. Each parameter value is followed by an up/down arrow, denoting a 15% increase (circle marks) or decrease (square marks) in the input parameter value as listed in Table 3. Each scenario is simulated starting in year 2019 and is followed to year 2033. The bars and arrows represent the median and interquartile ranges across 500 simulations. The triangle mark and dashed line represent the main model with no parameter variation. The results are summarized by showing the ten parameters for which variation resulted in the largest variations from the main model (decreasing impact from top to bottom. CVD, cardiovascular disease; NCD, non‐communicable diseases; DALY, disability‐adjusted life year; ART, antiretroviral therapy.
