
Figure 1. Cell Distance Distributions Describe Global Structure of High-Dimensional Data.
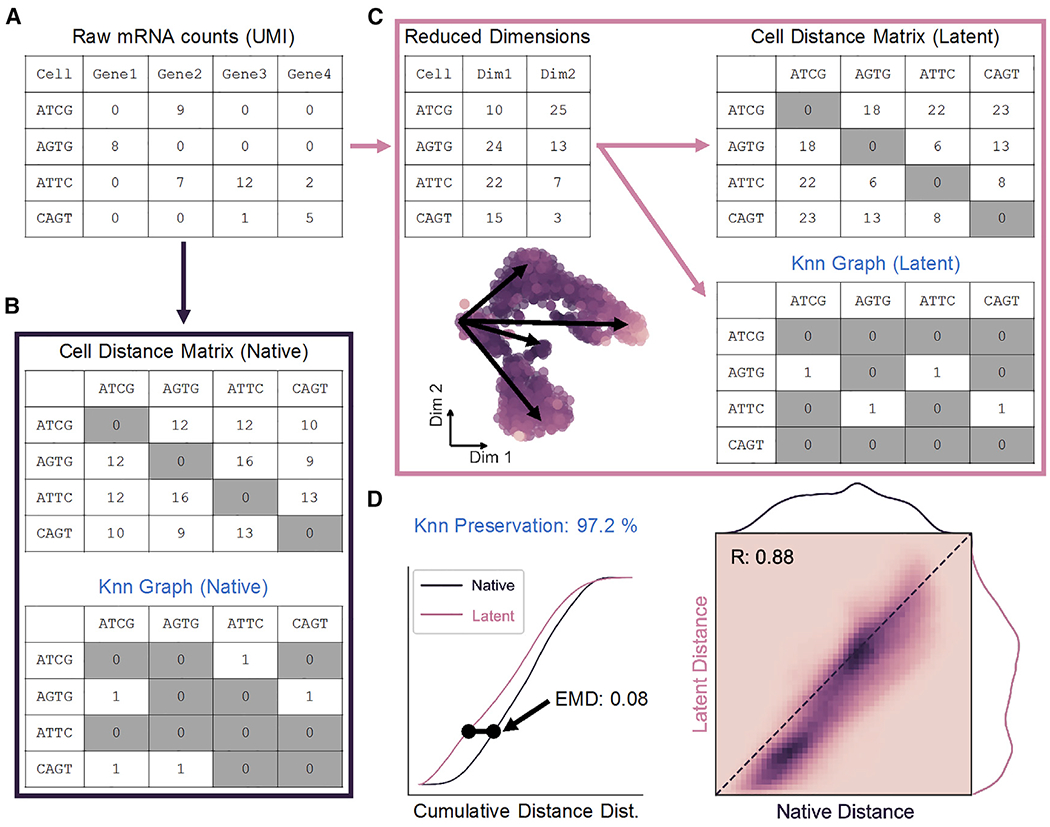
(A) Representation of scRNA-seq counts matrix.
(B) Cell-cell distances in native gene space are calculated to generate an m × m matrix, where m is the total number of cells. The K nearest-neighbor (Knn) graph is constructed from these distances as a binary m × m matrix.
(C) Upon transformation to low-dimensional space, a distance matrix and Knn graph can be calculated as in (B).
(D) Distance matrices from native (B) and latent (C) spaces are used to build cumulative probability density distributions, which can be compared to one another by Earth-Mover’s distance (EMD; left). Unique cell-cell distances are correlated (right), and Knn preservation represents element-wise comparison of nearest-neighbor graph matrices in each space.
See also Figure S1.