
Figure 2. Discrete and Continuous Cell Distributions Exemplify Common Biological Patterns.
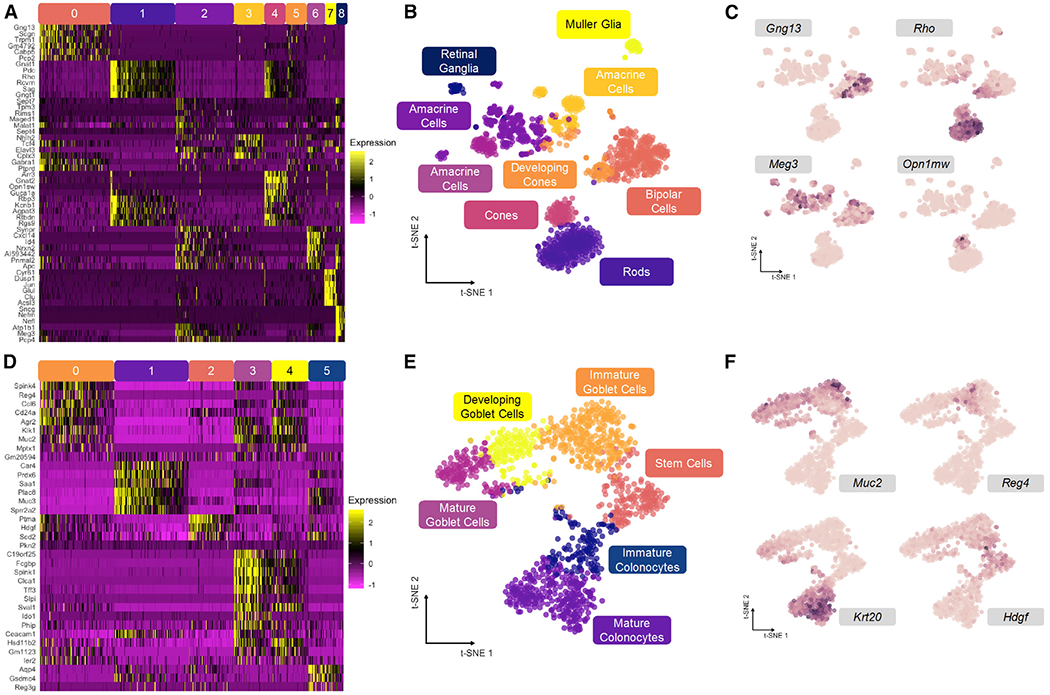
(A) Relative expression of top genes in each cluster for mouse retina dataset.
(B) t-SNE embedding primed with 100 principal components of retina dataset with overlay of consensus clusters.
(C) t-SNE projection from (B) with overlay of marker genes used to identify cell types in (A).
(D) Relative expression of top genes in each cluster for mouse colonic epithelium dataset.
(E) t-SNE embeding primed with 100 principal components of colon dataset with overlay of consensus clusters.
(F) t-SNE projection from (E) with overlay of marker genes used to identify cell types in (D).
See also Figure S2.