
Fig. 5.
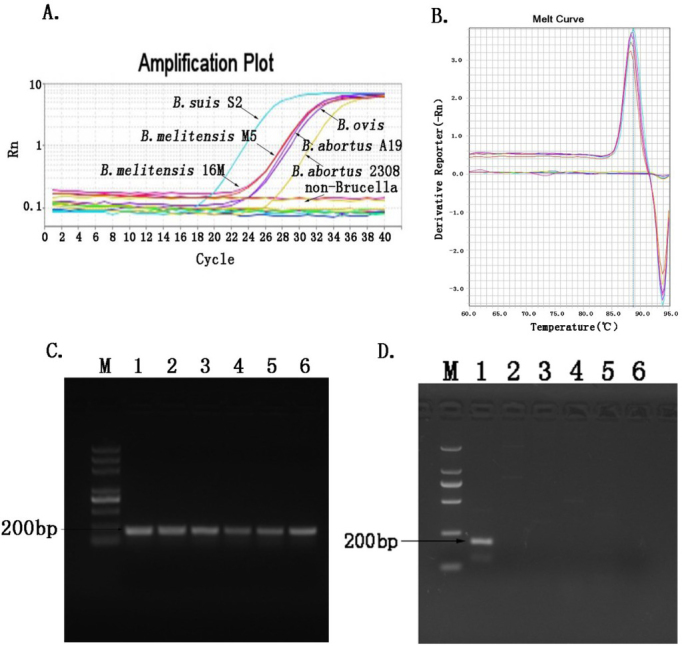
Analysis of the specificity of PMA-qPCR. A – amplification plot; B – melting curves of the qPCR amplification product; C – agarose gel electrophoresis of different Brucella species detected by the normal PCR, comprising M – DL5000 DNA Marker; lane 1 – B. suis S2; lane 2 – B. abortus 2308; lane 3 – B. abortus A19; lane 4 – B. melitensis M5; lane 5 – B. melitensis 16M; and lane 6 – B. ovis; D – agarose gel electrophoresis of species other than Brucella amplified by the conventional PCR, comprising M – DL2000 DNA Marker; lane 1 – B. suis S2; lane 2 – E. coli; lane 3 – S. typhimurium; lane 4 – Y. enterocolitica; lane 5 – V. parahaemolyticus; and lane 6 – RNase-free water