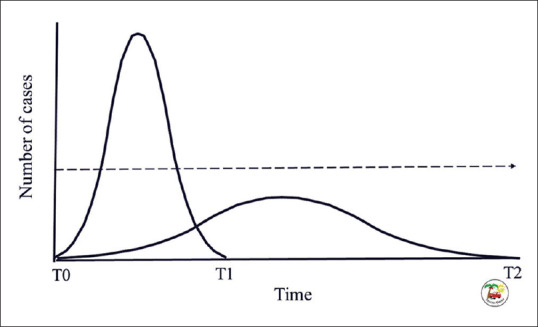
Figure 4.

An illustration demonstrating the principle of mitigation. The left curve represents the natural curve of an epidemic. The curve starts at time 0 (T0) and ends at time 1 (T1). The dashed line represents the health care capacity. The number of infected patients is much more than the system capacity. By reducing the progress of infection, the natural curve will flattened. The modified curve will start at time 0 (T0) and end at time 2 (T2). The aim is to reduce its peak to be less than the health care capacity. The same patients are treated over a longer period of time trying to give the desired health care standard (Illustrated by Professor Fikri Abu-Zidan)
