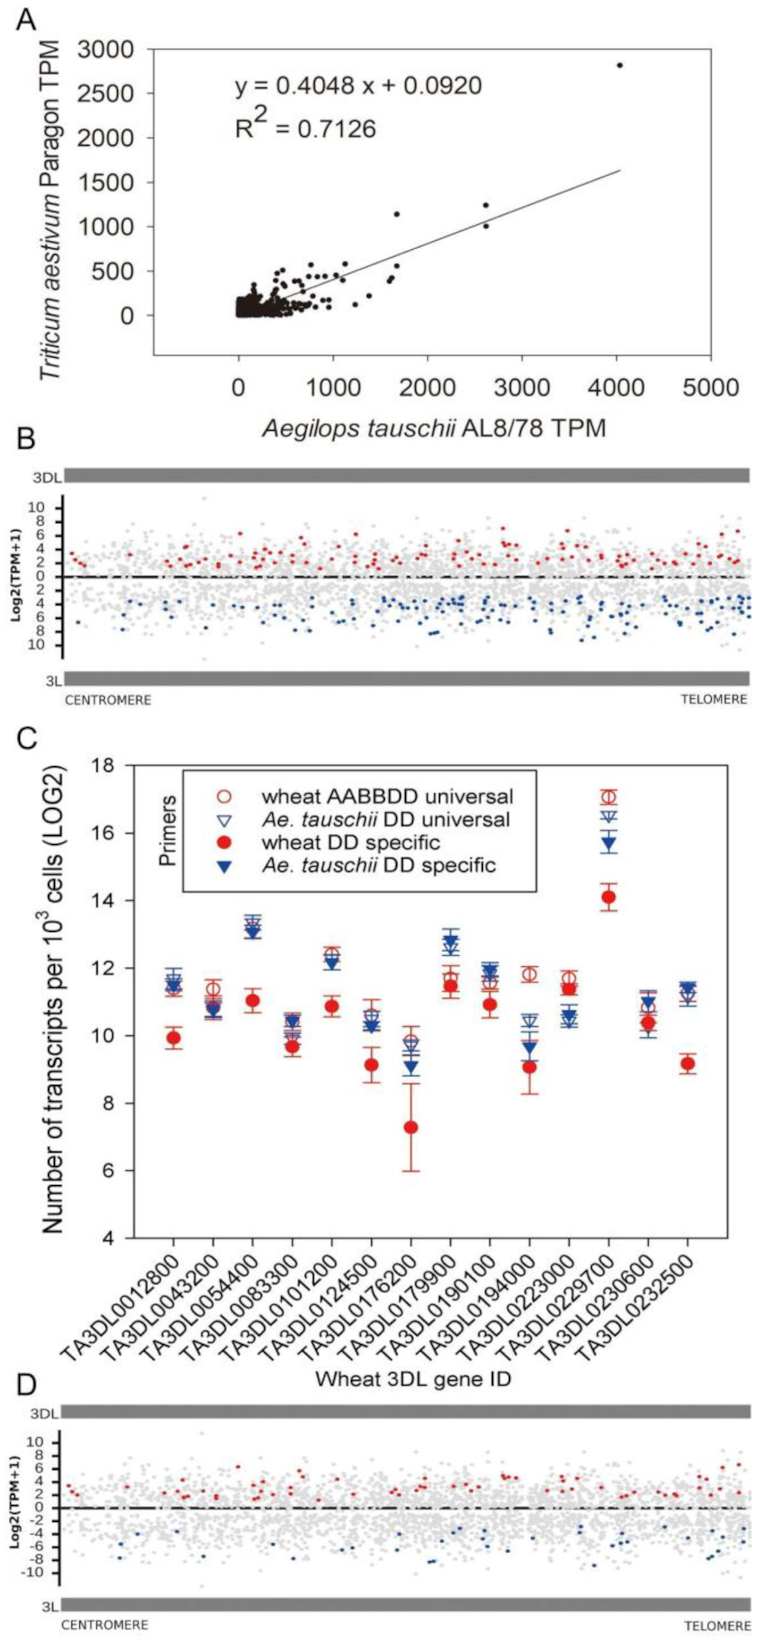
Figure 2:

Chromosome-scale differences in expression of syntenic gene pairs in wheat 3DL and Ae tauschii 3 L. (A) Comparison of gene expression levels between syntenic pairs of hexaploid wheat 3DL and diploid AL8/78 3 L genes. In total, 2,378 (68%) of the syntenic genes were expressed in each of the 5 tissues examined. A trend of reduction of hexaploid wheat 3DL gene expression to 40% of that observed in diploid Ae tauschii was observed. (B) Chromosomal locations of differentially expressed and proportionately reduced genes in leaf tissue of wheat 3DL and Ae tauschii AL8/78. The locations of 3,456 syntenic gene pairs are shown on the horizontal axis, with the centromere on the left and telomere on the right. Gene expression values (TPM) are on the vertical axis, with wheat TPM values shown on the upper panel and Ae tauschii TPM values shown on the lower panel. Expression of DEGs is shown by blue lines. Gene expression of proportionately reduced genes is shown as gray lines. (C) Expression levels of 14 syntenic gene pairs on wheat 3DL and Ae tauschii 3 L using absolute quantitative RT-PCR. The graph shows transcript levels expressed per leaf mesophyll protoplast on the vertical axis. The 14 genes (identified on the horizontal axis) were from among non-differential genes. For 11 of the 14 gene pairs, lower expression levels (41.78% on average) of the DD gene from wheat were seen compared to the same gene in diploid Ae tauschii. Universal primers can amplify all the homoeologs while specific primers can only amplify DD genes. (D) Chromosomal locations of 106 conserved DEGs and balanced genes in leaf tissue of Paragon 3DL and 3 Ae tauschii accessions AL8/78, Clae23, and ENT336. As in panel B, red lines mark those DEGs expressed more highly in wheat than the 3 Ae tauschii varieties, and blue lines indicate DEGs with higher expression in the 3 Ae tauschii lines compared to wheat. Gray lines indicate proportionately reduced gene expression patterns.
