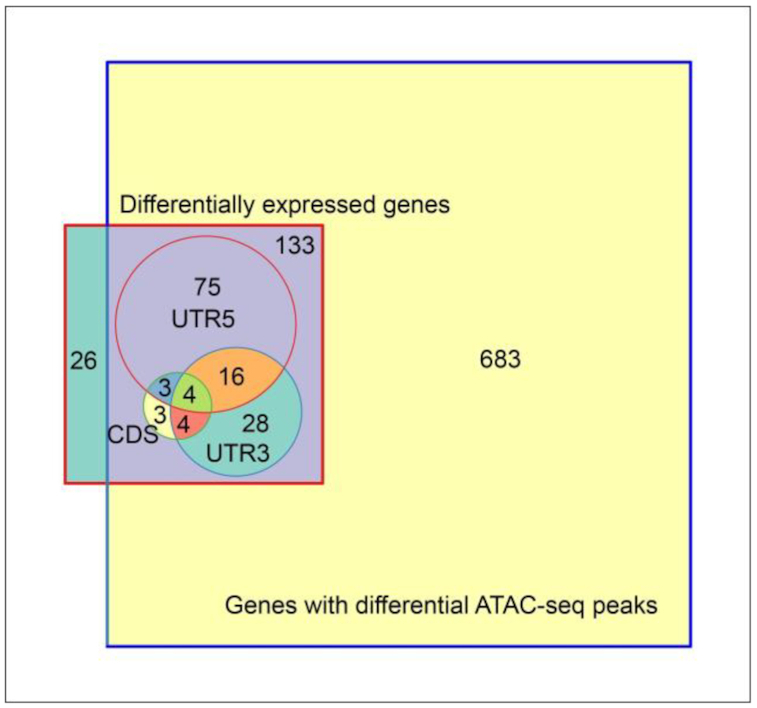
Figure 7:

Relationships between differentially expressed genes and differential ATAC peaks. The Venn diagram shows 683 genes with differential ATAC peaks on any region of genes on hexaploid 3DL and diploid 3 L. In total, 133 of 159 genes that are differentially expressed in leaf tissue (the tissue used for ATAC-seq) have differential ATAC peaks. Of these, most differential ATAC peaks occurred in the 5′UTR+promoter region (shown as UTR5).
