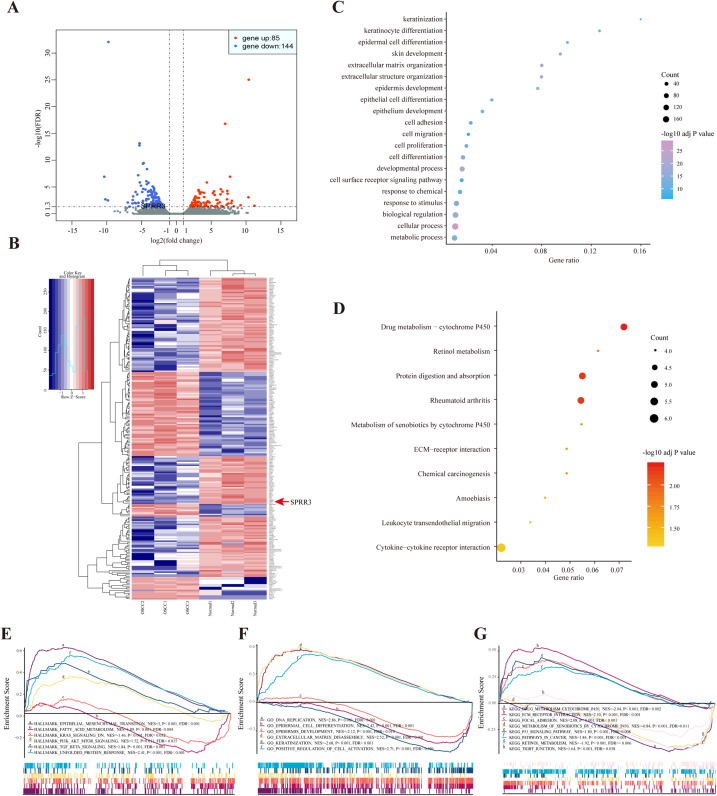
Figure 2. DEGs between OSCC and adjacent tissues.
(A) Volcano plot exhibits the high-throughput RNA-seq result. Among them, 85 genes were up-regulated (red plots) and 144 were down-regulated (green plots). SPRR3 was marked in the figure. (B) Heatmap of RNA sequencing result, red for up-regulated genes and blue for down-regulated genes. SPRR3 was marked in the figure. (C) GO enrichment of the DEGs. The DEGs are mostly correlated with keratinization, keratinocyte differentiation, ECM organization, cell adhesion and migration. (D) KEGG enrichment of the DEGs. The DEGs were enriched in xenobiotic metabolism, drug metabolism and chemical carcinogenesis, etc. (E) GSEA in hallmark enrichment, NES, P-value and FDR were listed respectively. The DEGs were enriched in epithelial mesenchymal transition, K-Ras signaling down and TGF-β signaling, etc. (F) GSEA in GO enrichment. The DEGs were enriched in DNA repication, epidermal cell differentiation, ECM disassembly and positve regulation of cell activation, etc. (G) GSEA in KEGG enrichment. The DEGs were enriched in drug metabolism, xenobiotic metabolism, focal adhesion, P53 signaling and tight junction, etc.

