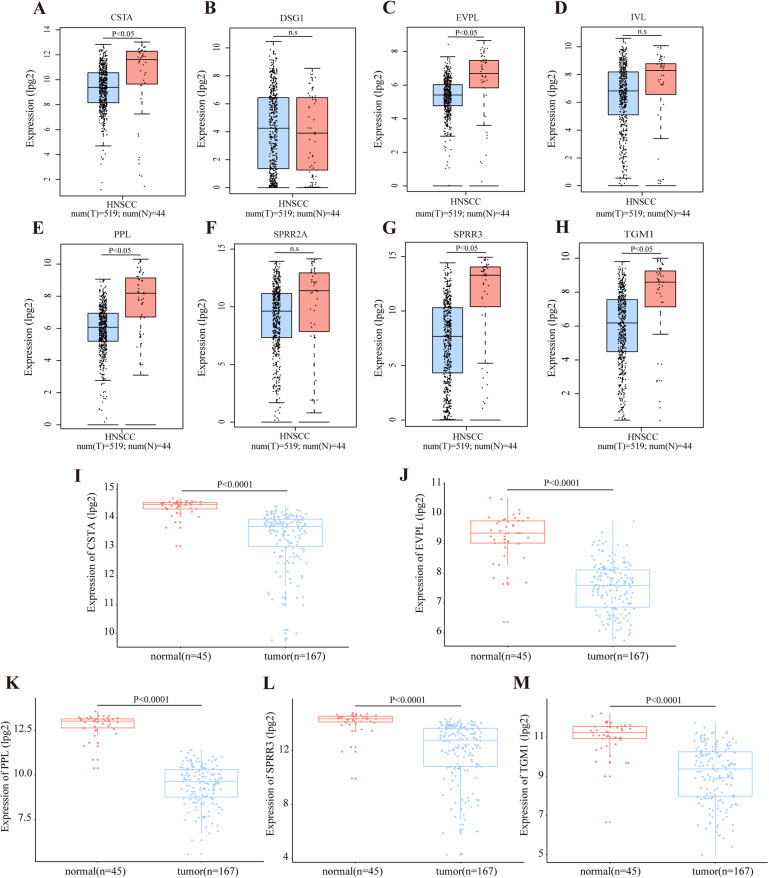
Figure 4. Transcriptional level of DEGs in OSCC.
(A–H) The transcription level of DEGs in module cluster 1 according to GEPIA. The expression levels of CSTA, PPL, EVPL, SPRR3 and TGM1 with P-value < 0.05 in student’s t test (two tailed) were significantly differentially expressed between tumor and normal tissues in HNSCC (n.s represents not significant). (I–M) The differentially transcript level of candidate genes in module cluster 1 in GSE30784 dataset. The expression levels of CSTA, PPL, EVPL, SPRR3 and TGM1 with P-value < 0.001 were significantly differentially expressed between tumor and normal tissues in OSCC by student’s t test (two tailed).

