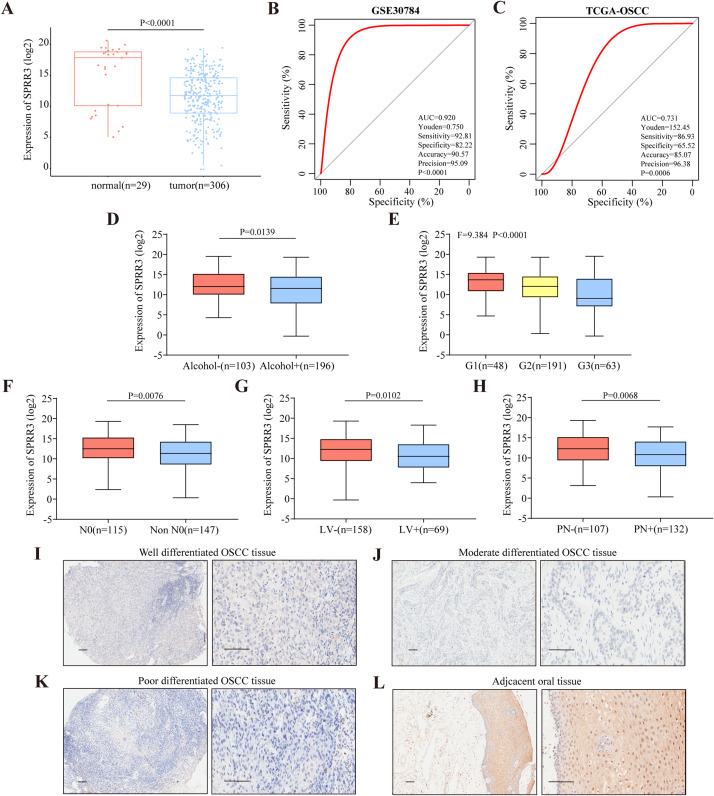
Figure 6. Clinical correlation of SPRR3 expression level in OSCC.
(A) The expression of SPRR3 in TCGA-OSCC database, the expression level of SPRR3 was significantly lower in tumor group than that in normal group by student’s t test (two tailed). (B) In GSE30784, ROC curve was created to verify the diagnostic value of SPRR3. AUC = 0.920, P-value < 0.001. (C) In ROC curve analysis from TCGA database, AUC was 0.731 and P-value = 0.001. (D–H) Two-tailed student’s t test and one-way ANOVA test suggested that SPRR3 was differentially expressed in groups in accordance of whether the patients had alcohol consumption (P = 0.0139), the histological grade (P-value < 0.0001), N stage (P-value = 0.0076) of the patients, and whether the patients had lymphovascular invasion (P-value = 0.0102), perineural invasion (P-value = 0.0068) respectively. (I) Protein expression level of SPRR3 in well differentiated OSCC tissue. (J) Protein expression level of SPRR3 in moderate differentiated OSCC tissue. (K) Protein expression level of SPRR3 in poor differentiated OSCC tissue. (L) Protein expression level of SPRR3 in adjacent tissue. The image on the left in the group was taken at the low power field (100*), the right was taken at the high-power field (400*). The black line represents the length of 100 nm.

