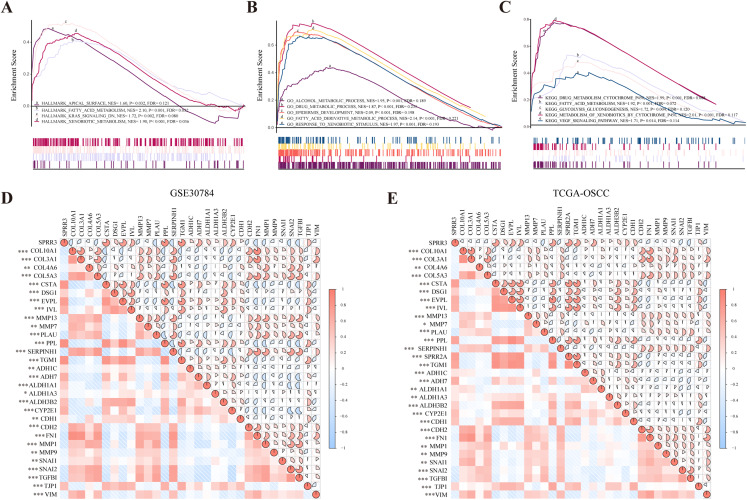
Figure 7. GSEA analysis of SPRR3 in TCGA database.
(A) SPRR3 was enriched in apical surface, fatty acid metabolism, K-Ras signaling down and xenobiotic metabolism in hallmark terms.(B) SPRR3 was enriched in alcohol metabolic, drug metabolic, epidermis development, fatty acid derivative process and response to xenobiotic stimulus in GO terms. (C) SPRR3 was enriched in drug metabolism cytochrome P450, fatty acid metabolism, glycolysis gluconeogenesis, metabolism of xenobiotics by cytochrome and VEGF signaling pathway in KEGG terms. (D) Pearson correlation analysis between DEGs in GSE30784 dataset. SPRR3 was positively correlated with other DEGs in module cluster 1 (CSTA, DSG1, EVPL, IVL, PPL, TGM1) and negatively correlated with DEGs in Module cluster 2 (PLAU, COL10A1, COL3A1, COL4A6, COL5A3), and it was positively correlated with ADH1C, ADH7, ALDH1A1, ALDH1A3, ALDH3B2, CYP2E1, CDH1, TJP1, it was negatively correlated with CDH2, FN1, SNAI1, SNAI2 and TGFBI. (E) Pearson correlation analysis between DEGs in TCGA-OSCC dataset. SPRR3 was positively correlated with other DEGs in module cluster 1 and negatively correlated with DEGs in Module cluster 2, and it was positively correlated with ADH1C, ADH7, ALDH1A1, ALDH1A3, ALDH3B2, CYP2E1, CDH1, TJP1, it was negatively correlated with CDH2, FN1, SNAI1, SNAI2 and TGFBI. The gauge on the right refers to the “r” of Pearson correlation test. Asterisk (*), double asterisk (**) and triple asterisk (***) stand for P-value < 0.05, P-value < 0.01 and P-value < 0.001, respectively.

