
Figure 1.
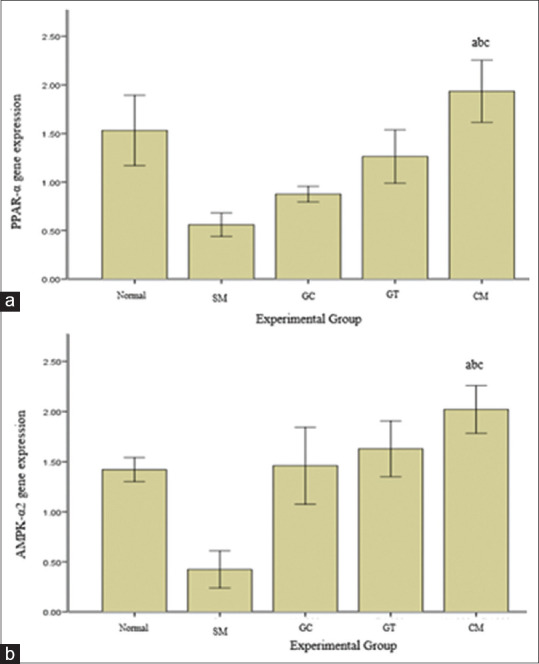
Green tea and green coffee bean extract combination effect on Peroxisome Proliferator-Activated Receptor α (a) and adenosine monophosphate-activated protein kinase α2 (b). Values are presented as mean ± standard deviation, n = 5. a: P <0.05 compared to the SM group. b: P < 0.05 compared to the GC group. c: P <0.05 compared to the GT group. SM: Metabolic syndrome, GC: Metabolic syndrome with green coffee extract 200 mg/kg. bw.t, GT: Metabolic syndrome with green tea extract 300 mg/kg. bw.t, CM: Metabolic syndrome with green coffee extract 200 mg/kg. bw.t and green tea extract 300 mg/kg. bw.t