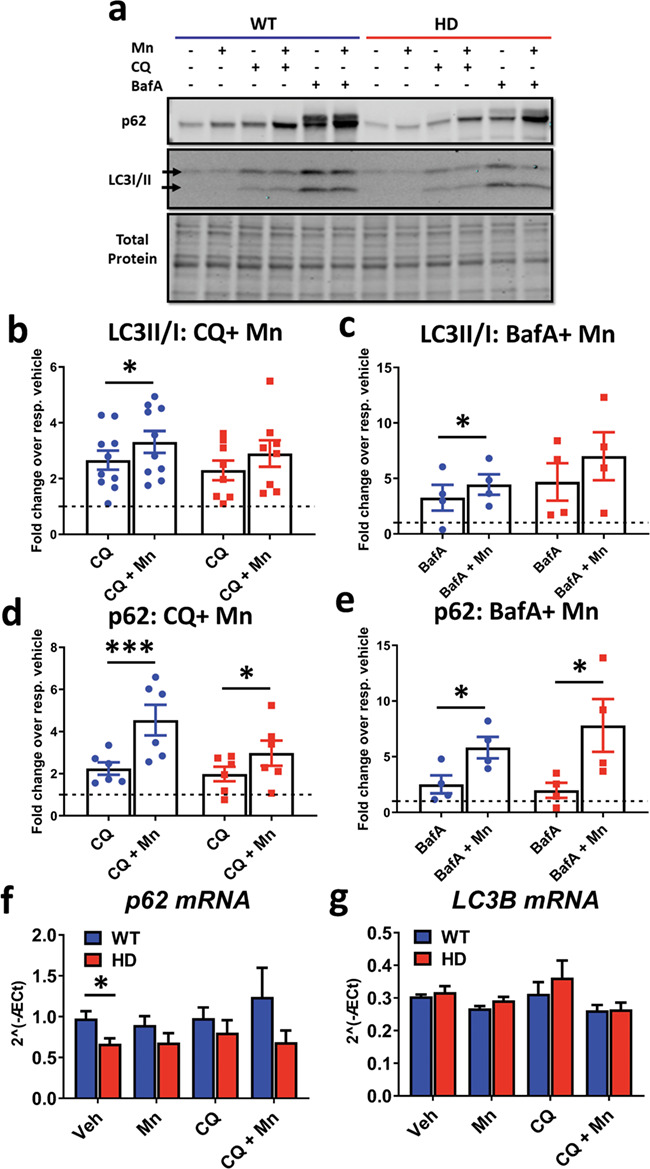
Figure 2.

Mn increases LC3-II/I and p62 expression in the presence of CQ and BafA. (a) Representative western blot of p62 and LC3-II/I in SThdh Q7/Q7 and Q111/Q111 after 24 h exposure with Mn (50 uM), CQ (10 uM) and BafA (10 nM). LC3-I = top arrow, LC3-II = bottom arrow. (b) Quantification of LC3-II/I in cells treated with CQ+Mn. Two-way ANOVA; treatment = F(1, 10) = 18.08; P = 0.0017. N = 8. (c) Quantification of LC3-II/I in cells after treatment with BafA+Mn. Two-way ANOVA; treatment = F(1, 3) = 2.374; P = 0.2211. N = 6. (d) Quantification of p62 in cells after treatment with Mn+CQ. Two-way ANOVA; treatment = F(1, 3) = 229.2; P = 0.006. N = 4. (e) Quantification of p62 in cells after treatment with BafA+Mn. N = 4. Two-way ANOVA; treatment = F(1, 3) = 10.13; P = 0.0500. In BafA-treated conditions, only the bottom band of p62 was quantified in order to compare to CQ-treated conditions where only one band was present. (f and g) qRT-PCR analysis for p62 (f) and LC3B (g) in STHdh Q7/Q7 and Q111/Q111 after 24 h treatment with Mn (50 uM) and/or CQ (10 uM). N = 4 for qRT-PCR results. Two-way ANOVA for p62; treatment = F(1.296,3.887) = 0.7953; P = 0.4590. Two-way ANOVA; genotype = F(1, 3) = 17.63; P = 0.0247; two-way ANOVA for LC3B; treatment = F(1.296,3.887) = 0.7953; P = 0.4590. Two-way ANOVA; genotype = F (1, 3) = 17.63; P = 0.0247. Blue = WT; red = HD. Error bars = SEM. Asterisks, significant difference from vehicle by post-hoc comparisons. *P < 0.05, **P < 0.01, ***P < 0.001. For b–e, Sidak’s multiple comparison test compared CQ/BafA and Mn+CQ/BafA for each genotype. For f and g, Dunnet’s multiple comparison test compared all treatments back to vehicle for each genotype.
