Figure 3.

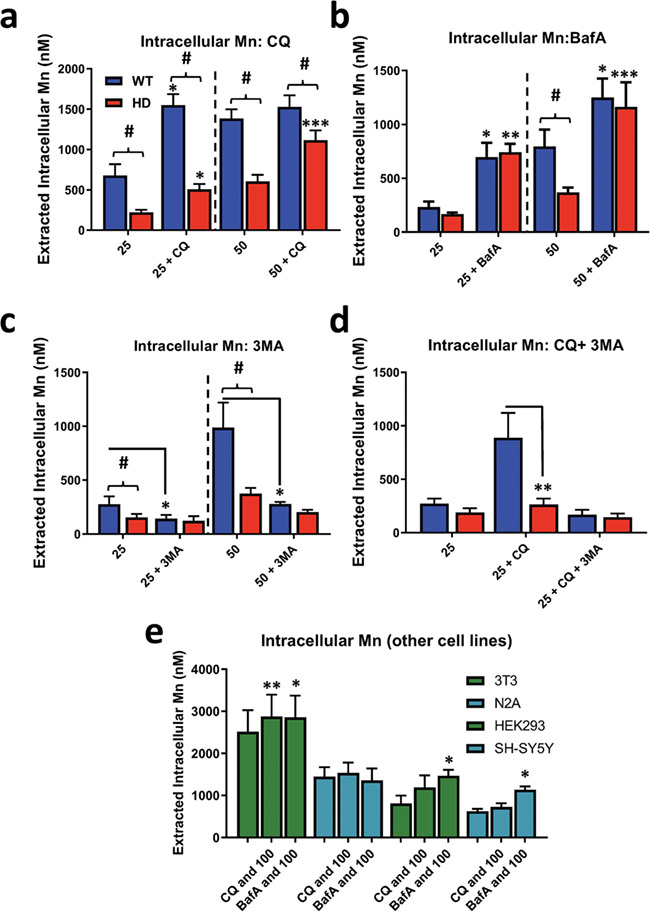
CQ and BafA increase net Mn uptake which is blocked by 3MA. Assessment of intracellular Mn by CFMEA in STHdh Q7/Q7 and Q111/Q111 cells after 24 h exposure with (a) Mn (25/50 uM) and CQ (10 uM), (b) Mn (25/50 uM) and BafA (10 nM), (c) Mn (25/50 uM) and 3MA (5 mM) and (d) Mn (25 uM), CQ (10 uM) and 3MA (5 mM). Note: dashed lines separate experiments where 25 uM or 50 uM Mn was used. N = 3 for all experiments; error bars = SEM. Blue = WT; red = HD. Number sign, significant genotype difference; asterisks, significance by Sidak multiple comparison test. Two-way ANOVA analysis in Supplementary Material, Figure S4. (e) CFMEA measuring intracellular Mn levels in NIH3T3, Neuro2A, HEK293 and SH-SY5Y cells after 24 h exposure with Mn (100 uM), CQ (10 uM) and BafA (10 nM). Asterisks, significance by paired student’s t-test compared to Mn alone at same concentration. *P < 0.05, **P < 0.01, ***P < 0.001.
