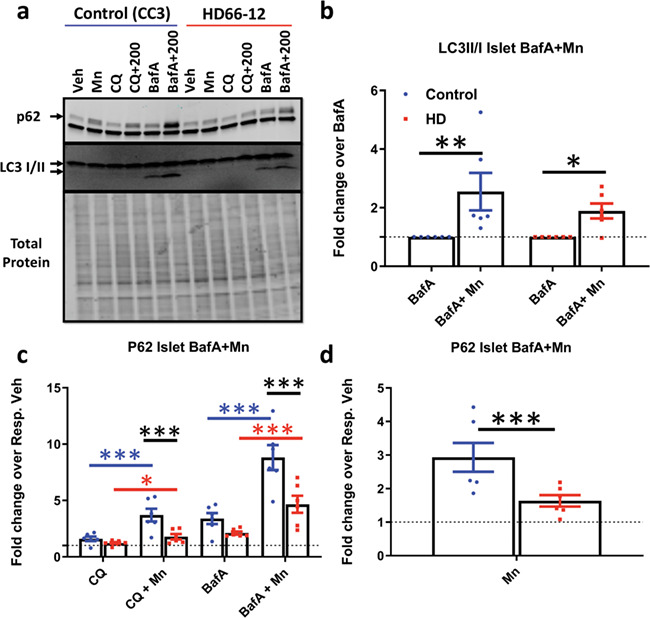
Figure 4.

HD patient iPSC-derived neuroprogenitors exhibit defects in Mn-induced autophagy. (a) Representative western blot of p62 and LC3-II/I in hiPSC-derived neuroprogenitors (CC3 = control cells; HD66-12 = HD cells) after 24 h exposure with Mn (200 uM), CQ (10 uM) and BafA (10 nM). p62 = top arrow, (non-specific LC3 band below p62); LC3-I = top arrow, LC3-II = bottom arrow. (b) Quantification of LC3-II/I in cells treated with BafA and BafA+Mn. N = 5. Dotted line: BafA = 1. Two-way ANOVA; F(1, 4) = 20.38; P = 0.0107. (c) Quantification of p62 after treatment with Mn and CQ, and BafA. (d) Quantification of p62 after treatment with Mn alone. Error bars = SEM. Blue = WT; red = HD. N = 6. Dotted line: vehicle = 1. Two-way ANOVA; treatment = F(4, 20) = 65.73; P = 0.0001; genotype = F(1, 5) = 13.40; P = 0.0146; treatment–genotype interaction = F(4, 20) = 3.730; P = 0.0200. Asterisks, significant by Sidak (b) Tukey’s (c) multiple comparison test. Blue asterisks, WT treatment difference; red asterisks, HD treatment difference; black asterisks, genotypes difference. *P < 0.05, **P < 0.01, ***P < 0.001.
