
Figure 5.
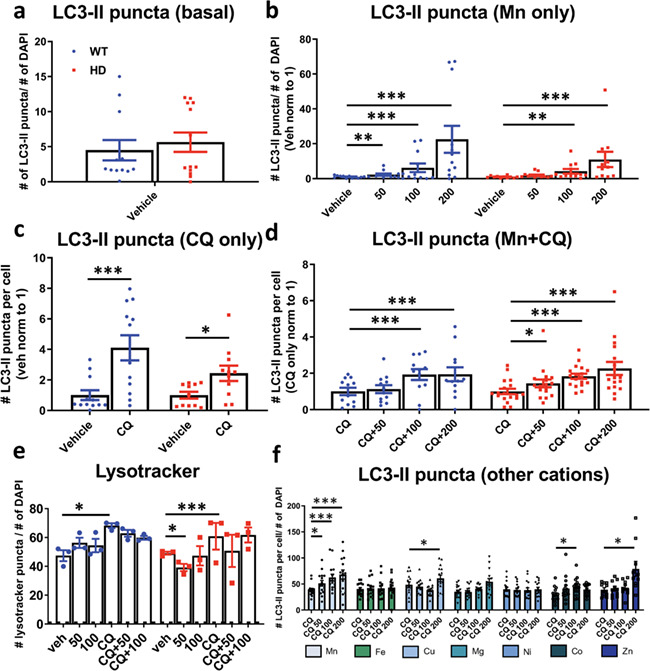
Mn increases LC3-II puncta. Quantification of number of LC3-II puncta over number of DAPI in STHdh Q7/Q7 and Q111/Q111 after 24 h exposures with (a) untreated (basal), (b) Mn (50/100/200 uM), (c) CQ (10 uM) or (d) Mn (50/100/200 uM) + CQ (10 uM). Quantified as (# of LC3-II puncta)/(# of DAPI) per image. N = 3–4 biological replicates; each with five images per condition. Images of the vehicle treatment (or CQ in panel f) per biological set were all averaged, and this value was set to 1. All other data points in each biological set were normalized respective to this value. Error bars = SEM. Two-way ANOVA statistics for panel b–d shown in Supplementary Material, Figure S5. (e) Quantification of number of lysotracker puncta per number of DAPI puncta after 24 h treatment with Mn (25/50/100 uM) and/or CQ (10 uM) in STHdh Q7/Q7 and Q111/Q111. Quantified as (# lysotracker puncta)/(# of DAPI) per image. Two-way ANOVA; treatment = F(5, 70) = 9.456; P ≤ 0.0001. N = 3 biological replicates with 5 images per set. Error = SEM. Blue = WT; red = HD. (f) Quantification of LC3-II puncta after 24 h treatment with Mn, Fe, Cu, Mg, Ni, Co, Zn (0/50/100/200 uM) with CQ (10 uM) for 24 h. Two-way ANOVA; treatment = F(31, 34) = 15.43; P ≤ 0.0001. N = 3 biological replicates, each with 5 images per condition. Quantified as (# LC3-II puncta)/(# of DAPI) per image. Error bars = SEM. Asterisks, significant difference from Veh (b, c and e) or CQ (d and f) by Dunnet’s multiple comparison test. *P < 0.05, **P < 0.01, ***P < 0.001.