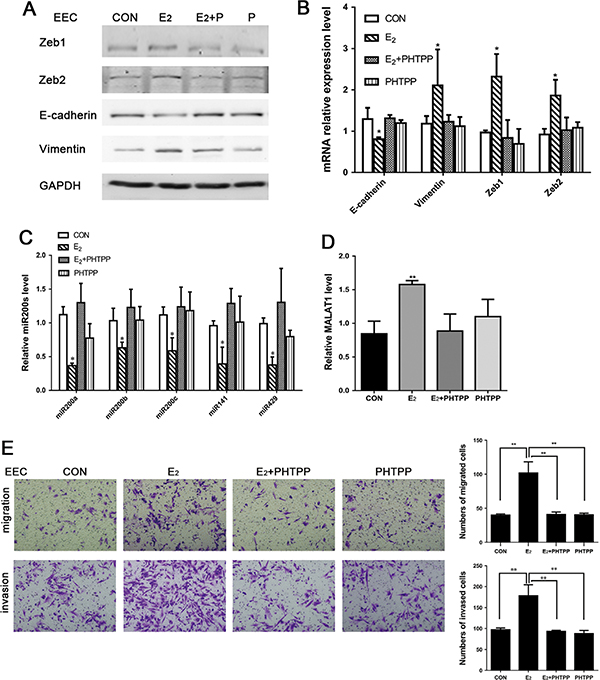
Figure 3.
(A) Protein expression levels of EMT-associated markers in EECs with treatment of E2 and/or PHTPP for 48 h analyzed by Western blot; (B, C and D) RNA expression levels of EMT-associated markers, MALAT1 and miR200s treated with E2 and/or PHTPP in EECs for 24 h analyzed by qRT-PCR; (E) E2 promoted migration and invasion of EECs and PHTPP reversed the effect. Data were evaluated by one-way ANOVA analysis (*P < 0.05, **P < 0.01, ***P < 0.001). Photographs were taken at magnifications of 200×.

