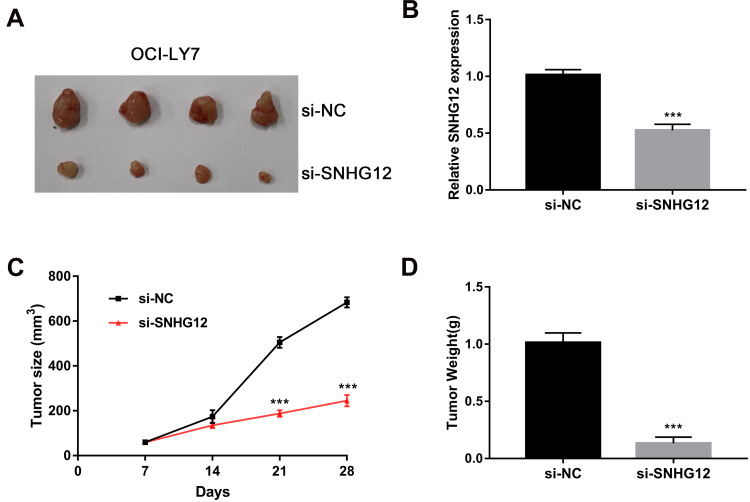
Figure 4.
SNHG12 knockdown suppressed tumorigenesis of DLBCL cells in vivo. (A) Representative images of the tumors generated by si-NC and SNHG12 knockdown OCI-LY7 cells (4 mice per group). (B) Relative expression of SNHG12 was detected by quantitative real-time PCR in xenograft tissues. (C) Growth (mm3) curves of the tumors. (D) Tumor weight (g) of the tumors. Data are presented as mean ± SD of three independent experiments. ***P < 0.001.

