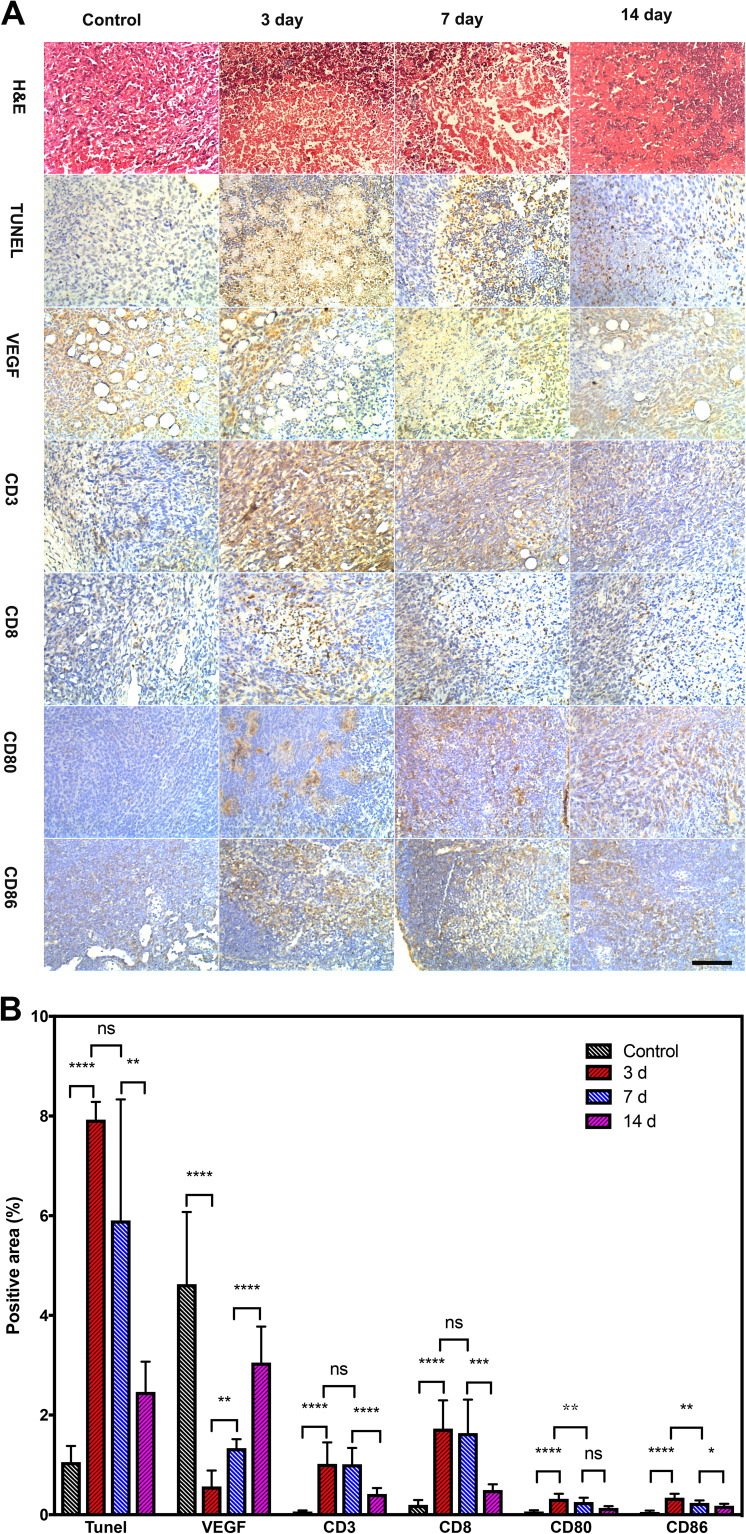
Figure 9.
Immunohistochemical staining of the APS/AuNR/PLGA-PEG NPs+ FUS group on day 0, 3, 7, and 14. (A) H&E staining (first row), TUNEL staining (second row), VEGF staining (third row). Immunohistochemical staining of positive expression (brown) of tumor-infiltrating CD3+ (fourth row), CD8+ (fifth row), and lymphoid-infiltrating CD80+ (sixth row), CD86+ (the last row) in the control group: 0 day (left column) and APS/AuNR/PLGA-PEG NPs+ FUS group at 3 days (second column), 7 days (third column) and 14 days (right column). Original magnification, 200×. Bar, 50 μm. (B) Corresponding statistical analysis columns, mean; error bar. *P < 0.05; **P< 0.01; *** P < 0.001; ****P<0.0001. Data were pooled from two independent experiments with five mice per group.
Abbreviations: APS, astragalus polysaccharide; AuNRs, gold nanorods; PLGA, poly(lactic-co-glycolic) acid; PEG, polyethylene glycol; NPs, nanoparticles; FUS, focused ultrasound; TUNEL: TdT-mediated dUTP nick-end labeling; H&E, hematoxylin-eosin; VEGF, vascular endothelial growth factor; CD, cluster of differentiation.

