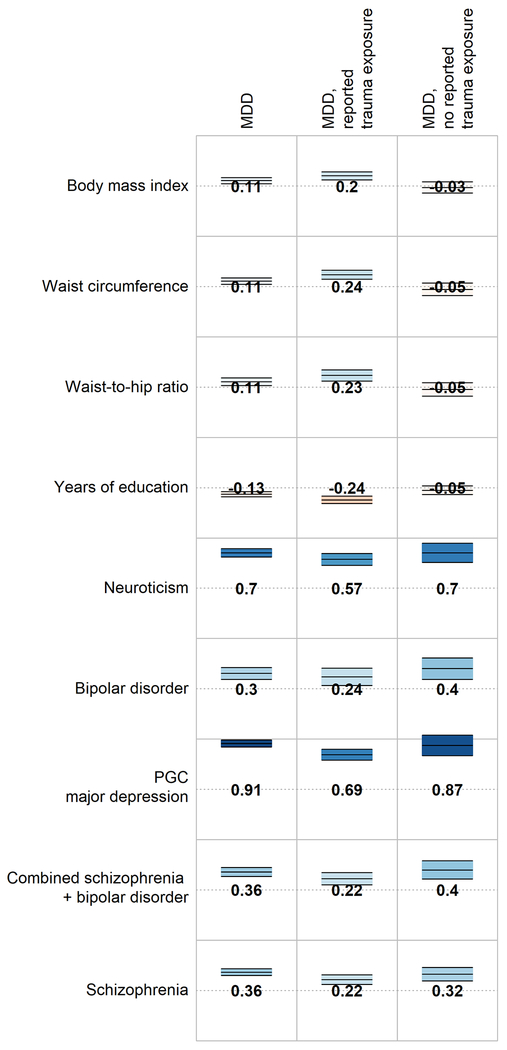
Figure 1:
Genetic correlations between MDD (overall and stratified by reported trauma exposure) and selected traits and disorders. Full genetic correlation results are available in Supplementary Table 9. Numbers = genetic correlations. Colour = direction of effect (blue = positive, red = negative). Colour intensity = size of correlation. Upper and lower bars are 95% confidence interval of genetic correlation.

