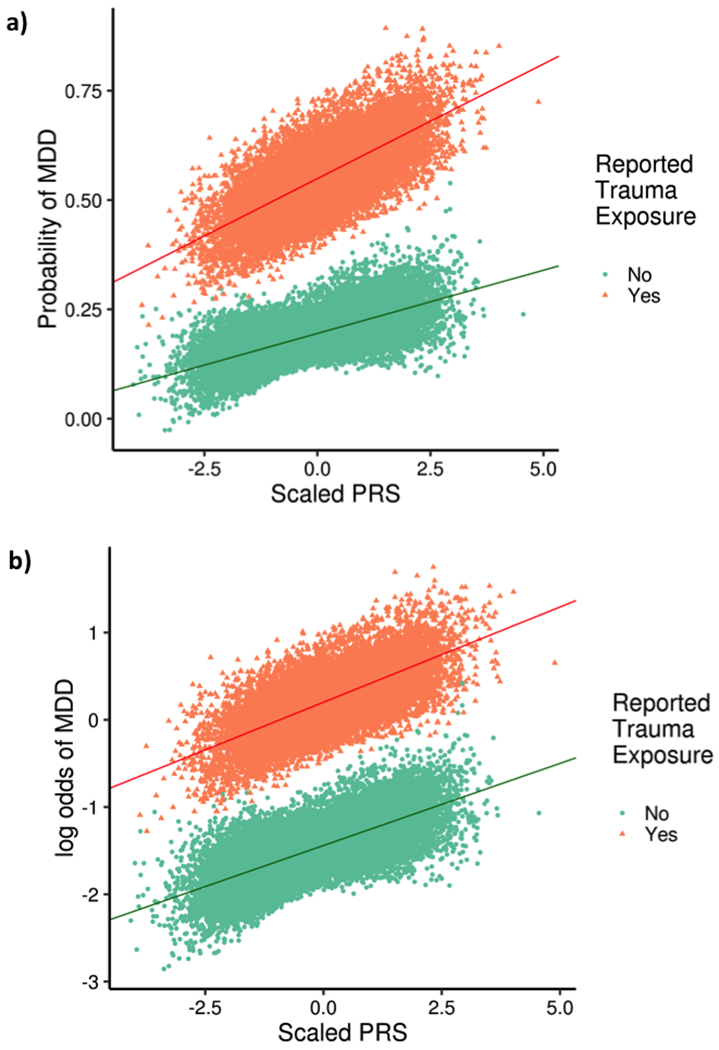
Figure 2:

Association between MDD polygenic risk score (PRS) and MDD. Individuals reporting trauma exposure are shown as orange triangles, and those not reporting trauma exposure as green dots. Panel a shows the relationship on the linear additive scale, and panel b shows the relationship on the multiplicative scale. A significant interaction is observed on the additive scale only, as shown by differing slopes of the two regression lines in panel a.
