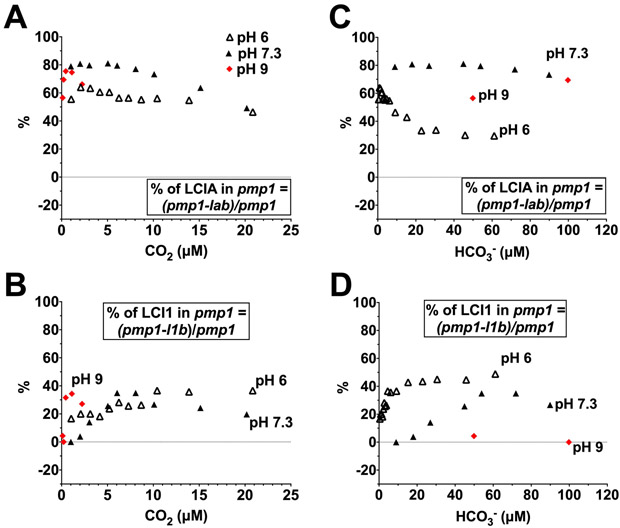
Figure 11.
Percentage of LCIA (A, C) and LCI1 (B, D) uncompensated contribution to photosynthesis in a pmp1 mutant background at pH 6 (open triangles), pH 7.3 (closed triangles) and pH 9 (red diamonds) plotted as a function of calculated CO2 concentrations of 0–25 μM (A, B) and of calculated HCO3− concentrations of 0–120 μM (C, D).

