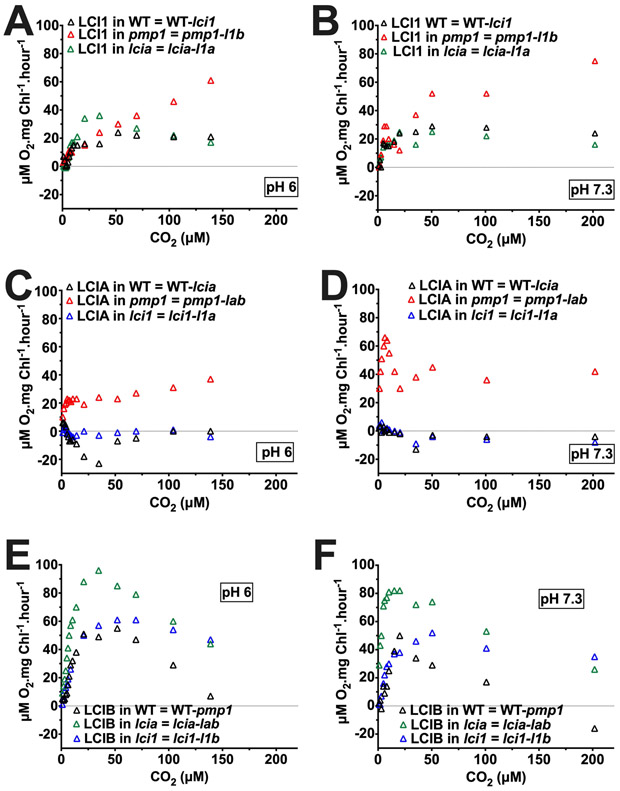
Figure 12.
Calculated, uncompensated contribution of LCI1 (A, B), LCIA (C, D), and LCIB (E, F) at pH 6 (left) and at pH 7.3 (right) in a wild-type background (black triangles), a pmp1 mutant background (red triangles), an lcia background (green triangles), and an lci1 mutant background (blue triangles). CO2 concentration was calculated from total Ci assuming CO2 and HCO3− are in equilibrium. Uncompensated contributions were calculated by subtracting the O2 evolution rates of the mutant from those of its background strain (LCI1 in wild type = 21gr-lci1; LCI1 in pmp1 = pmp1-l1b; LCI1 in lcia = lcia-l1a; LCIB in wild type = 21gr-pmp1; LCIB in lcia = lcia-lab; LCIB in lci1 = lci1-l1b; LCIA in wild type = 21gr-lcia; LCIA in lci1 = lci1-l1a; LCIA in pmp1 = pmp1-lab). l1b is the LCI1/LCIB double mutant; lab is the LCIA/LCIB double mutant; l1a is the LCI1/LCIA double mutant.

