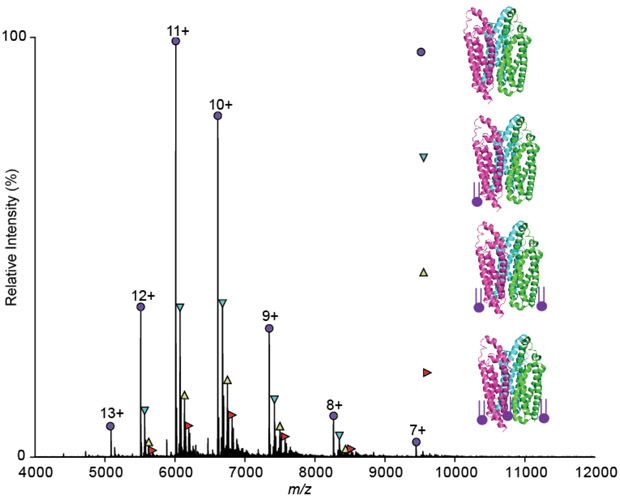
Figure 5.
Mass spectrum of LCI1 obtained under native conditions. The spectra indicate the presence of the LCI1 trimer (purple circles) and its charge state series. The measured mass of this trimer is 66113.01 ± 0.27 Da, which is in good agreement with the theoretical mass of the trimeric LCI1 protein (66115.8 Da) without the first methionine residue on each monomer. The other species (cyan, yellow and red triangles) correspond to the lipid bound trimers, and these are endogenously purified. Lipid analysis on this sample revealed the presence of PA(16:0/18:1) and PA(18:1/18:1) as shown in Figure S2, which are bound in different numbers and combinations. All the molecular masses observed are listed in Table S2.

