Figure 6.
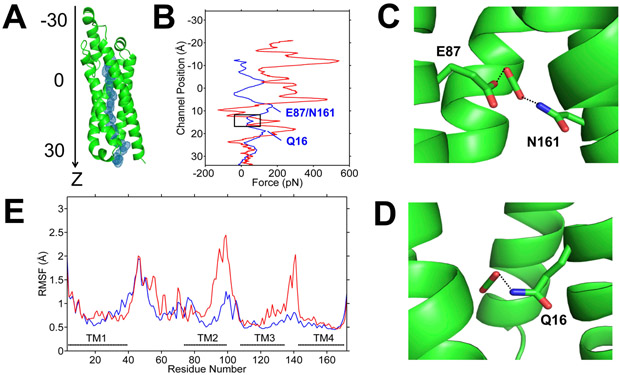
Steered molecular dynamics (SMD) simulations of the migration of CO2 and HCO3− through LCI1. (A) CO2 trajectory through LCI1 in SMD is shown as blue mesh. LCI1 is oriented with the channel along the z-axis and the position of ligand along the channel is measured as distance from the protein center of mass along the z-axis. (B) Plots of applied forces as a function of ligand positions along the channel (blue, CO2; red, HCO3−), which indicate that pushing HCO3− through the channel requires much larger force, suggesting that CO2 may be the preferred ligand. A black rectangle highlights the region corresponding to the putative CO2-binding site. The two peaks marked in the CO2 plot (blue) indicate local electrostatic interactions between (C) putative bound CO2 and residues E87 and N161; and (D) putative bound CO2 and residue Q16. (E) Root mean square fluctuations (RMSF) of the LCI1 residues during the SMD simulations with CO2 (blue) and HCO3− (red).

