
Figure 3. KAP1 Recruits a Pathway Specific Factor to Stimulate Pol II Pause-release.
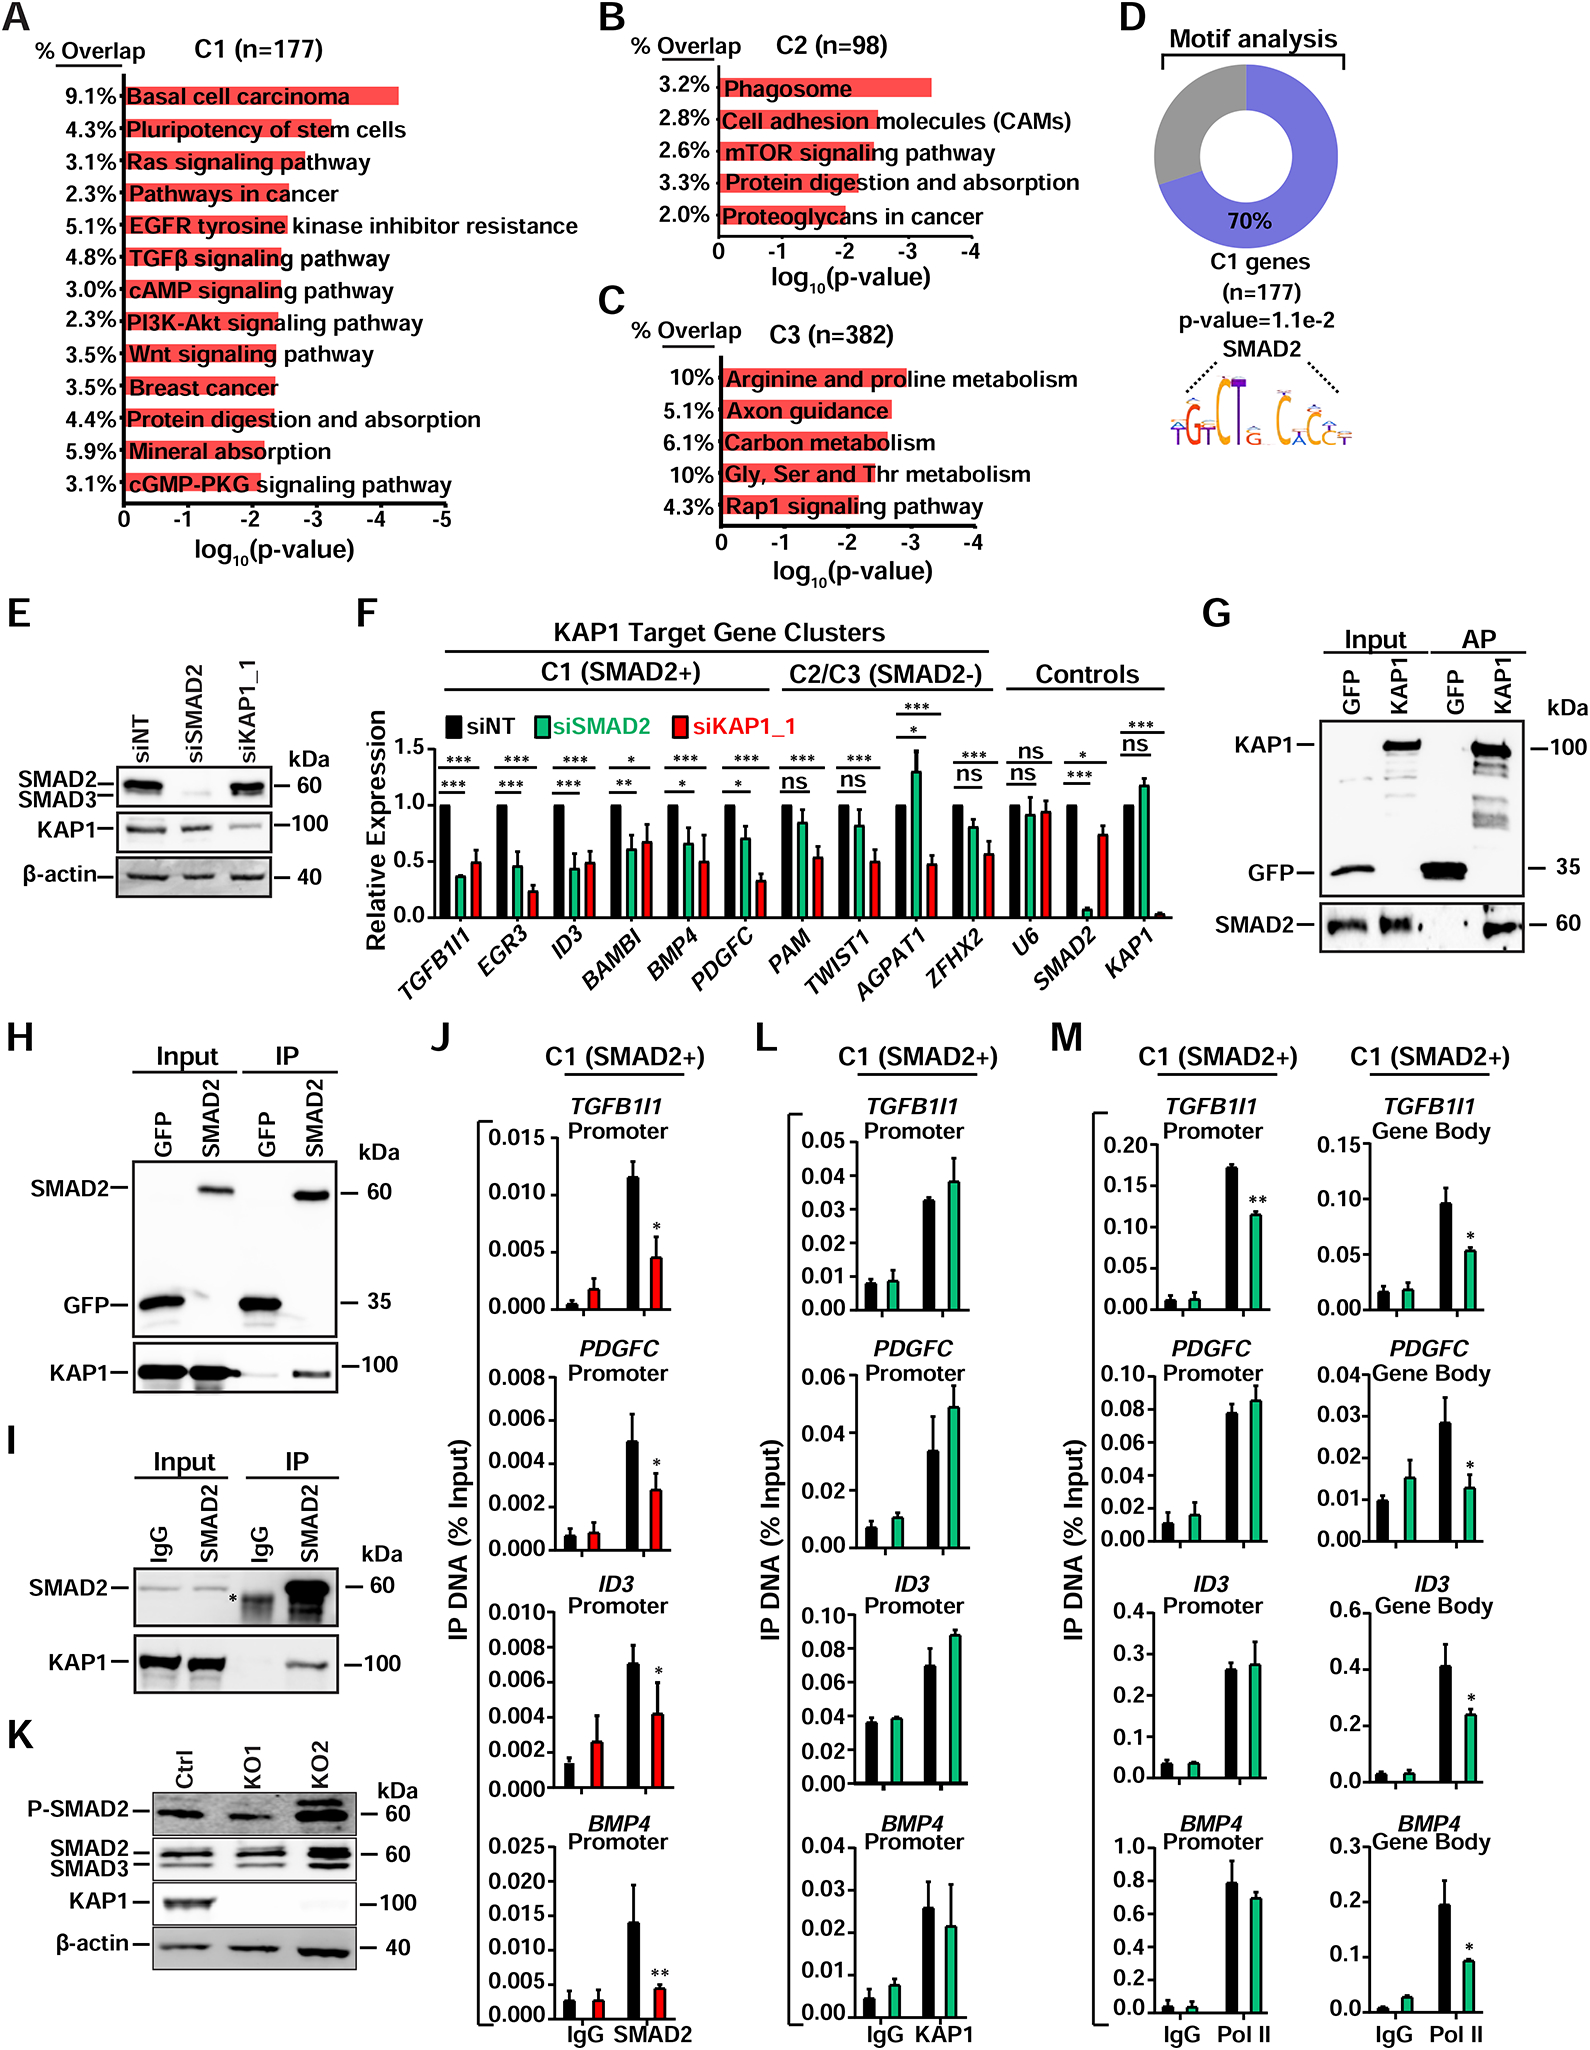
(A–C) KEGG pathway analysis for the three gene clusters. Pathways with P<0.01 are shown.
(D) Enriched SMAD2 DNA motifs in promoter regions for C1 genes.
(E) Western blot validating KD efficiency in HCT116.
(F) Expression levels of genes after RNAi in HCT116 (mean expression relative to siNT ± SEM; normalized to RPL19; n=3).
(G) STREP AP of ectopically expressed STREP-tagged KAP1 (same AP from Figure 2C)
(H) FLAG IP of ectopically expressed FLAG-tagged SMAD2 from HCT116 nuclear extract.
(I) Endogenous IP of SMAD2 from HCT116 nuclear extracts. *IgG.
(J) ChIP-qPCR of SMAD2 at the indicated gene promoters (mean ± SEM; n=3).
(K) Western blots of the indicated factors.
(L) ChIP-qPCR of KAP1 at the indicated gene promoters (mean ± SEM; n=2).
(M) ChIP-qPCR of Pol II at the indicated gene regions (mean ± SEM; n=2).