
Figure 5. Direct H4 Tail Binding is Necessary for KAP1 Promoter Occupancy and Target Gene Activation.
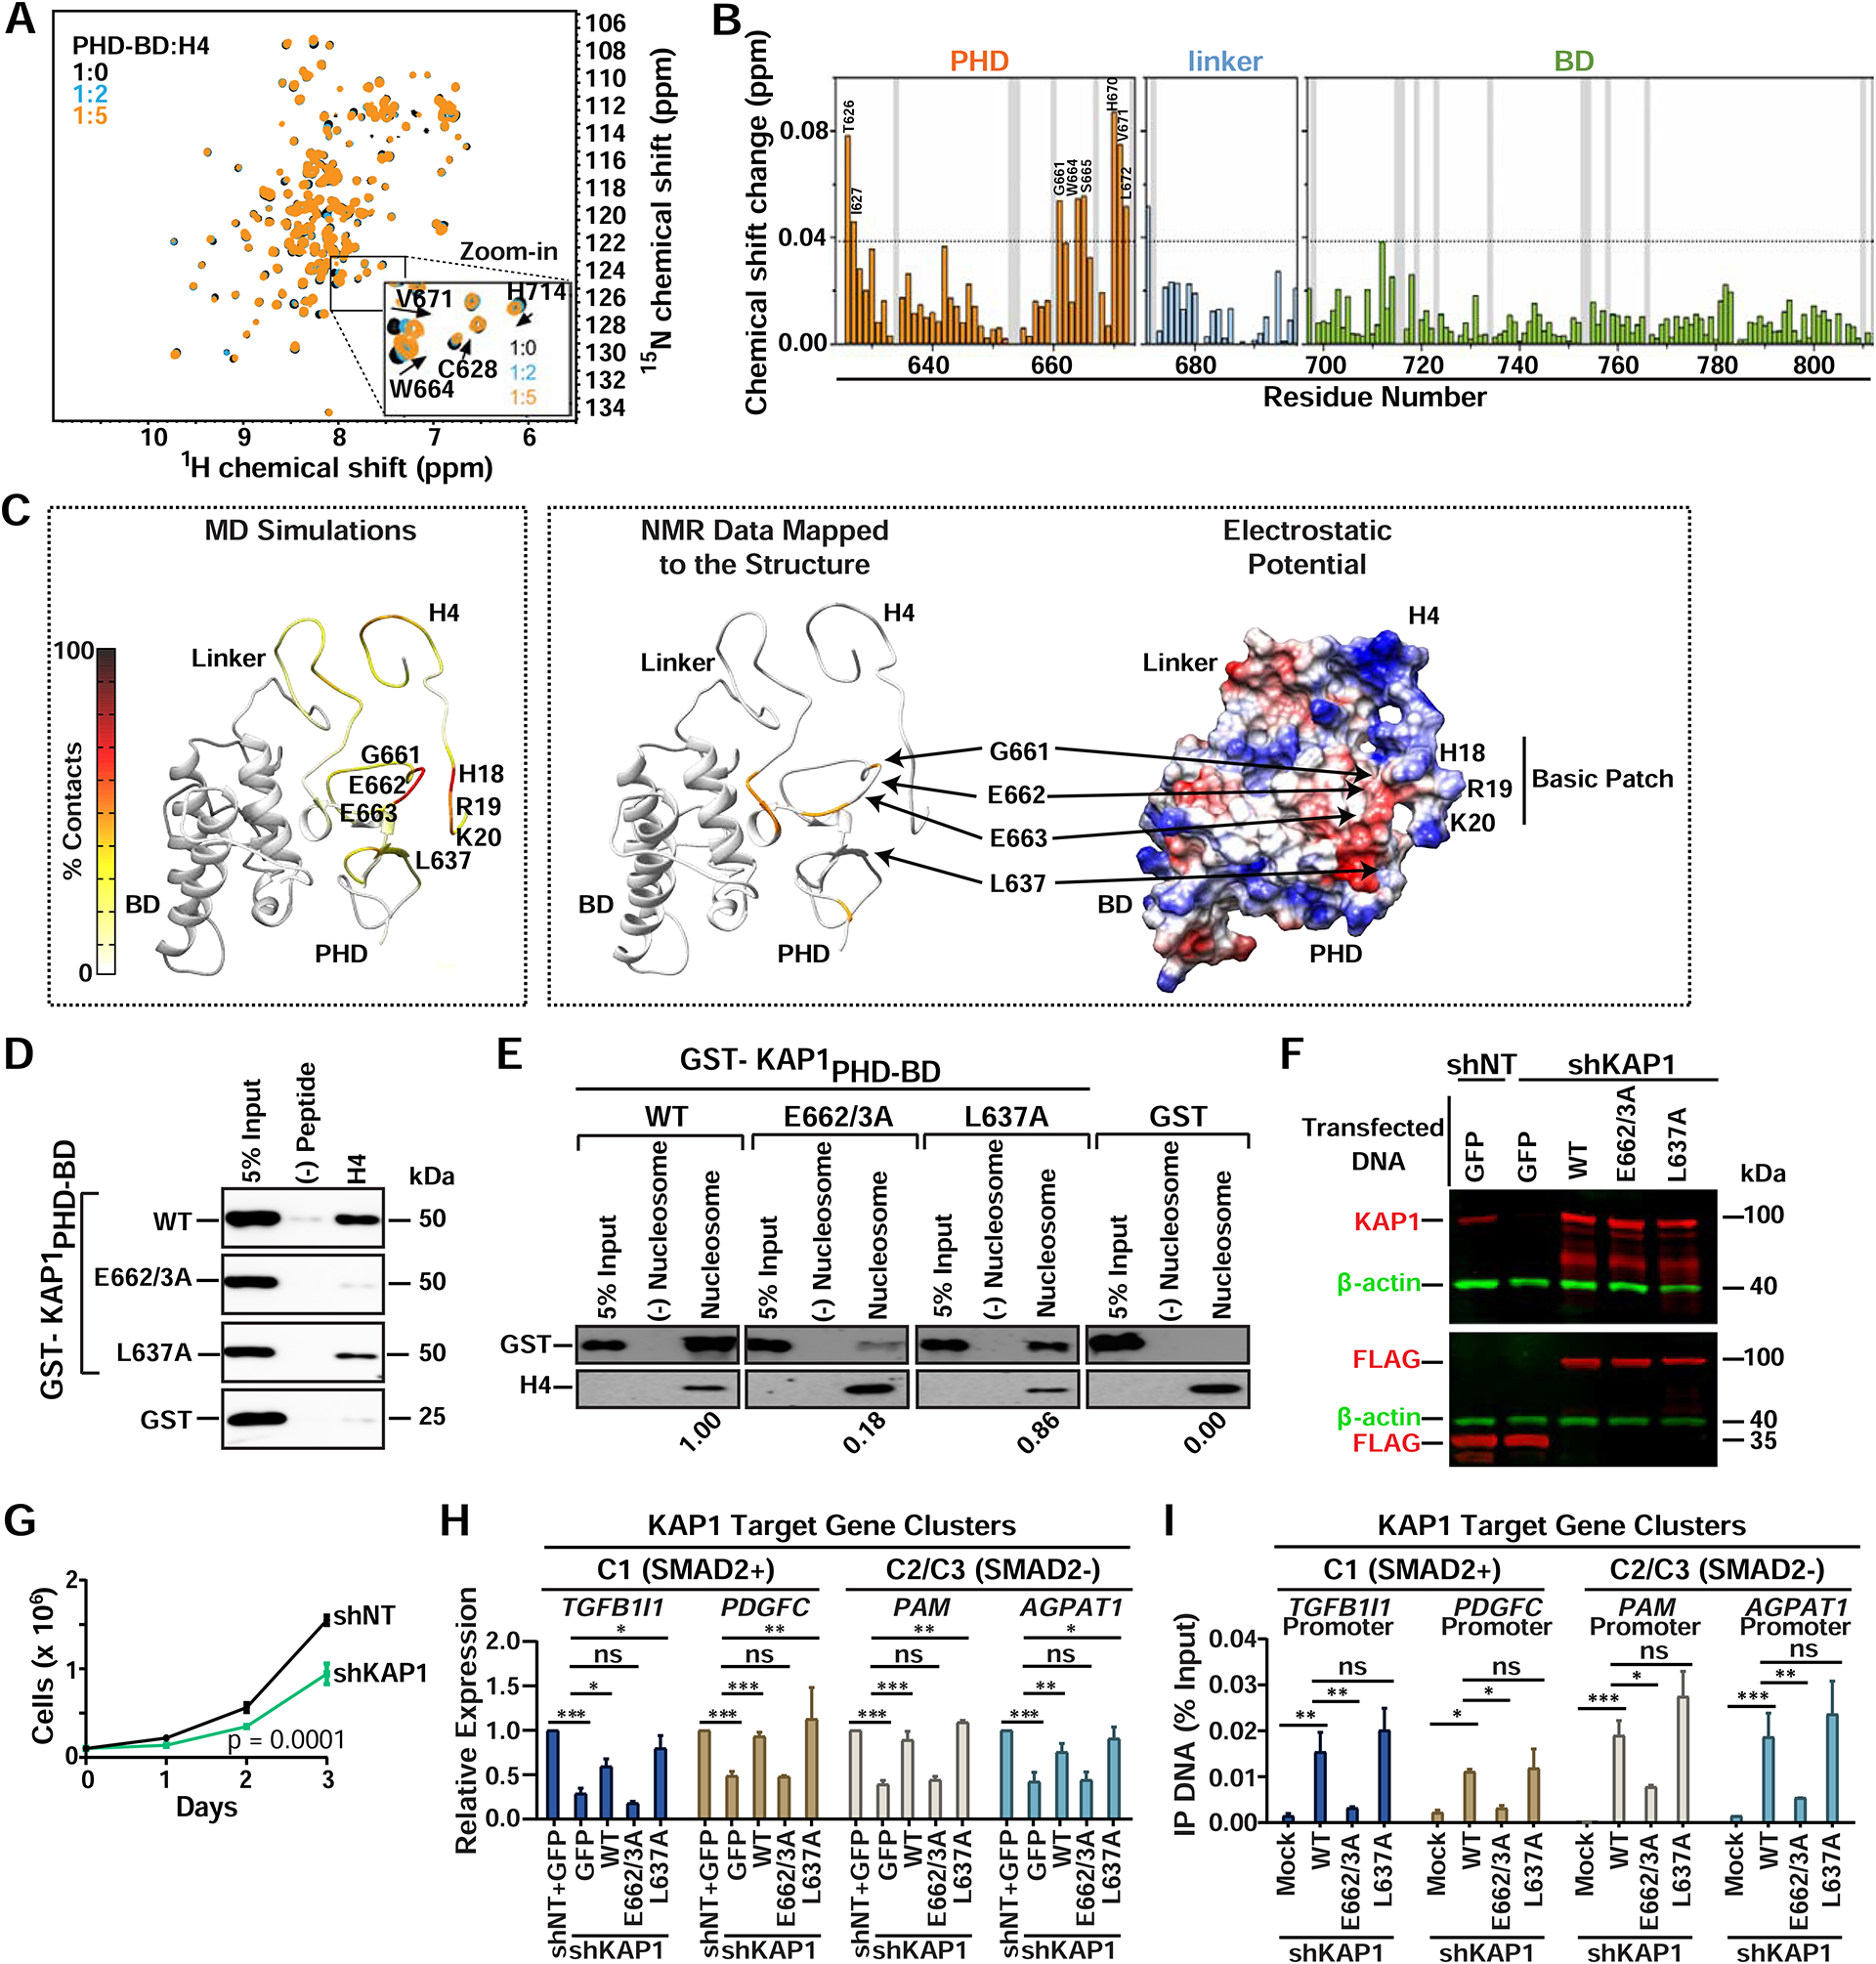
(A) The 1H, 15N HSQC spectra of KAP1PHD-BD collected upon titration with H4 peptide. Inset shows residues displaying chemical shifts. Spectra are color-coded according to the PHD-BD:H4 molar ratio.
(B) Histogram showing chemical shift perturbations. Vertical grey bars indicate Pro and unmapped residues. The dash line indicates a threshold value of average + 3×SD. Chemical shift assignments of the apo-PHD-BD state were from BMRB (ID 11036).
(C) Left: Predicted model depicting the frequency of residue specific contacts between KAP1PHD and H4 in the production run of the MD simulations using backbone amide resonances in panel (A) as restraints. Middle: Residues exhibiting H4-induced resonance perturbations above threshold are mapped in orange onto the structure of the predicted complex. Right: The electrostatic surface potential of the predicted complex is colored blue and red for positive and negative charges, respectively.
(D-E) In vitro binding assay between recombinant proteins and (D) H4 peptide or (E) biotinylated mono-nucleosomes. Western blots probed with anti-GST. Quantitation relative to WT KAP1 of (E) are shown.
(F) Western blot of KAP1 proteins in the indicated HCT116 cell lines.
(G) Cell growth assay (cell counts ± SEM; n=3).
(H) RT-qPCR of KAP1 target genes after reconstitution of the indicated proteins in shKAP1 HCT116 (mean expression relative to shNT+GFP ± SEM; normalized to RPL19; n=3).
(I) FLAG ChIP-qPCR of the indicated proteins at KAP1 target gene promoters (mean % Input DNA ± SEM; n=3).