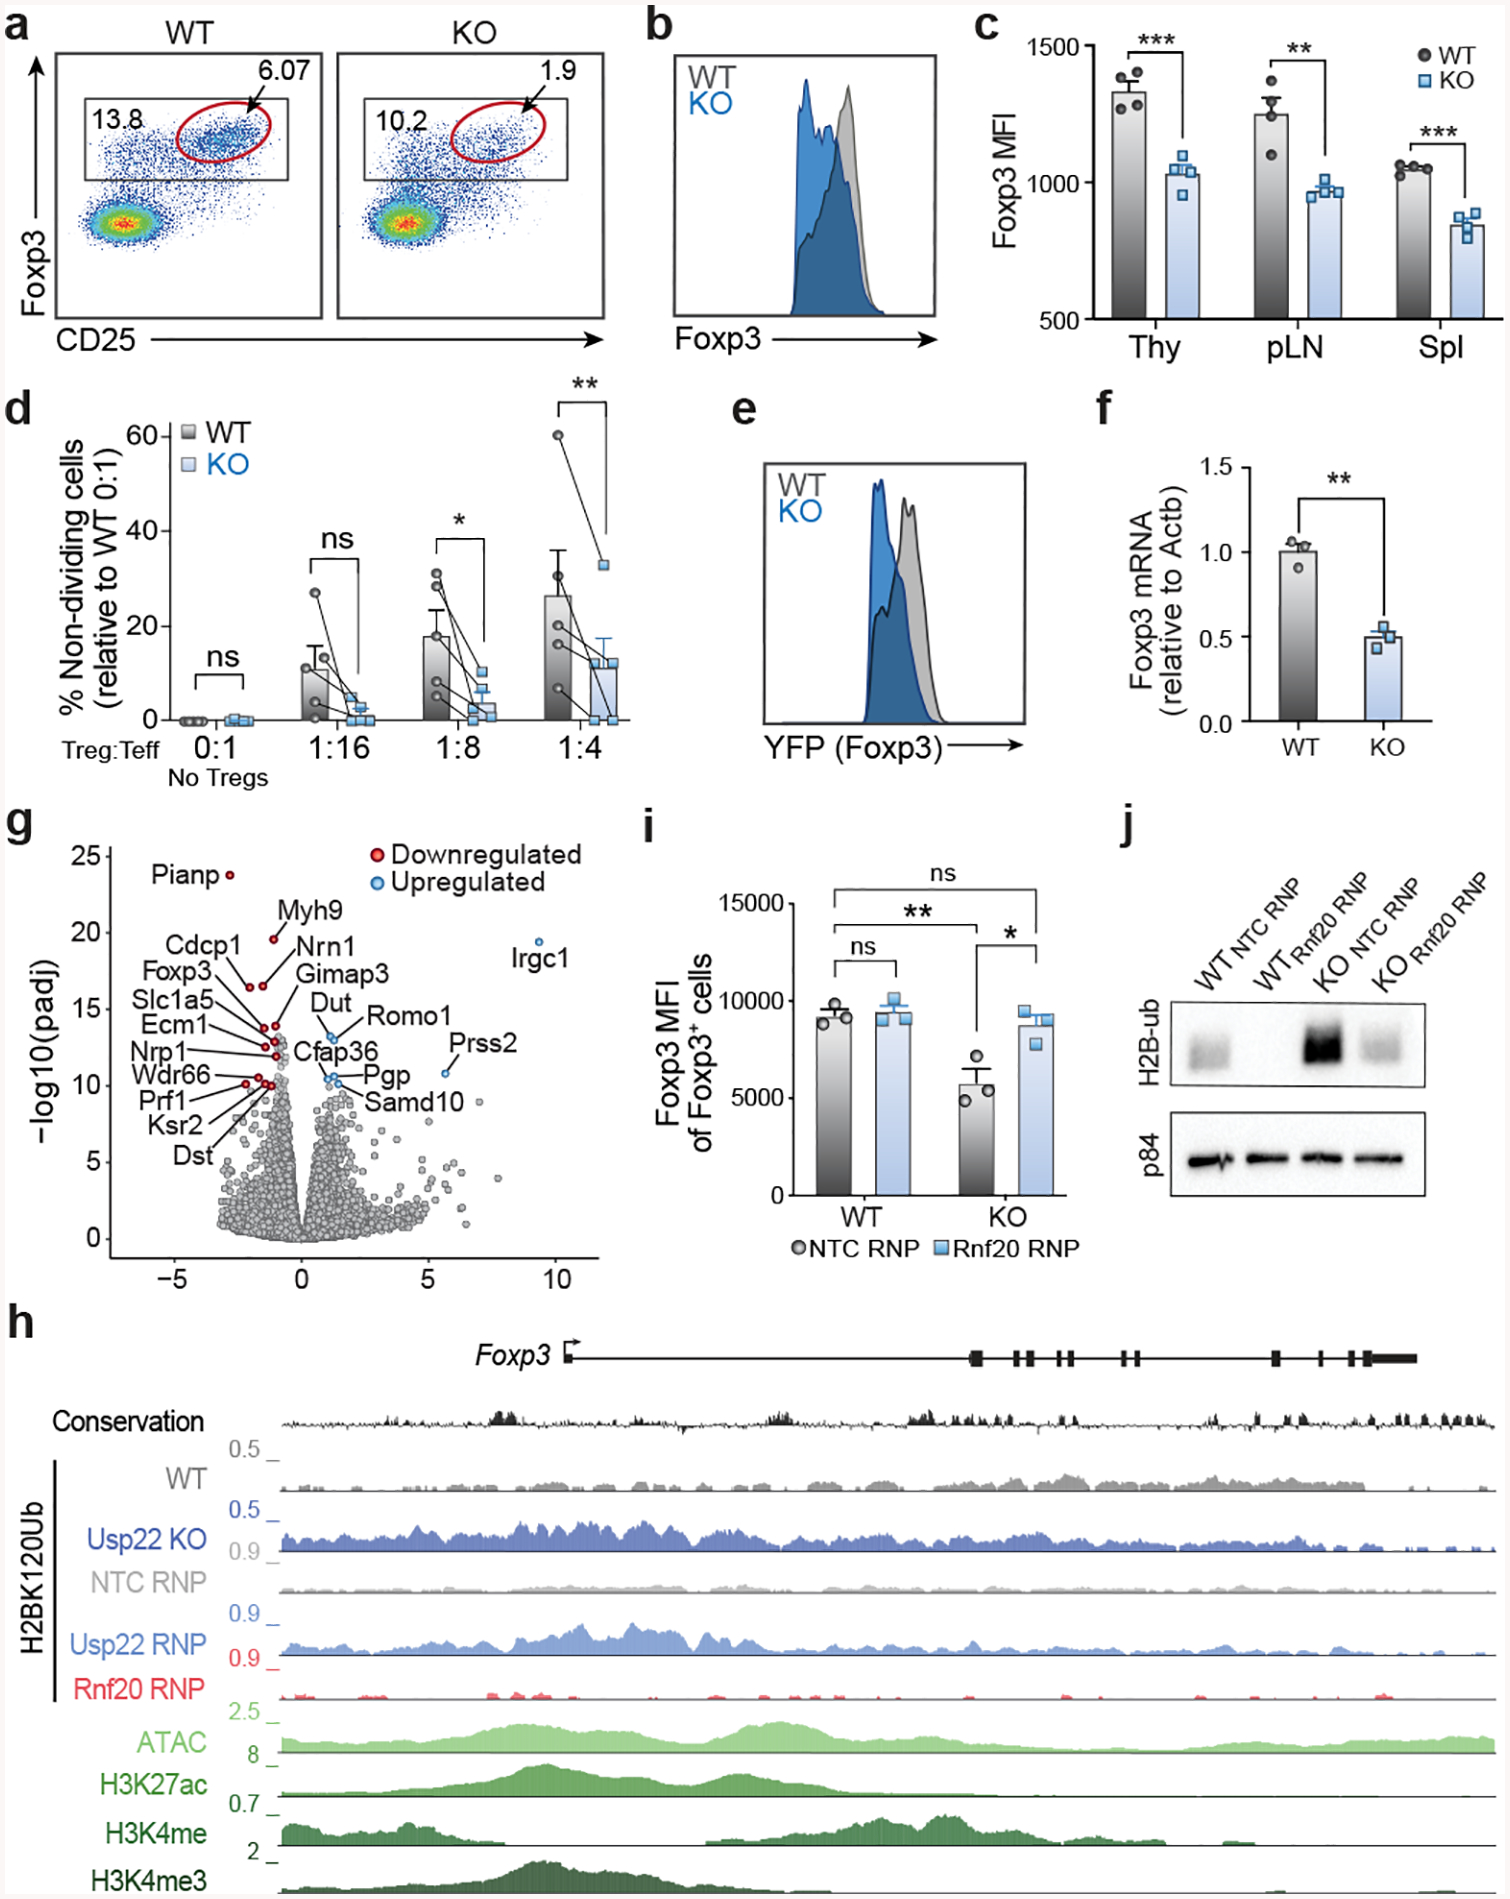
Figure 2. Usp22 is Required for Foxp3 Maintenance and Treg Suppressive Function.

a) Representative flow cytometry analysis of the Treg population (gated on CD4+ cells) from the spleen of Usp22+/+Foxp3YFP-Cre WT or Usp22fl/flFoxp3YFP-Cre KO mice. A subset of Tregs with the highest expression of Foxp3 and CD25 is highlighted with a red gate.
b) Histogram of Foxp3 expression in Foxp3+ Tregs from spleens of Usp22+/+Foxp3YFP-Cre WT or Usp22fl/flFoxp3YFP-Cre KO mice from panel a.
c) Statistical analysis of Foxp3 MFI from CD4+Foxp3+ Tregs in thymus (Thy), peripheral lymph nodes (pLN) and spleen (Spl) of Usp22+/+Foxp3YFP-Cre WT or Usp22fl/flFoxp3YFP-Cre KO mice.
d) Summary data of in vitro suppression experiments, corresponding to Extended Figure 3h. Lines connect paired samples. Data are presented as the frequency of non-dividing cells relative to WT 0:1 No Treg control, with any negative values after normalization replaced with 0.
e) Histogram of YFP expression in Tregs from the spleen and lymph nodes of Usp22+/+Foxp3YFP-Cre WT or Usp22fl/flFoxp3YFP-Cre KO mice from Extended Data Fig. 5a.
f) qPCR analysis of Foxp3 mRNA levels in sorted YFP+ cells of spleen from Usp22+/+Foxp3YFP-Cre WT or Usp22fl/flFoxp3YFP-Cre KO mice.
g) Volcano plot for RNA sequencing of YFP+ Tregs sorted from Usp22+/+Foxp3YFP-Cre WT or Usp22fl/flFoxp3YFP-Cre KO mice. X-axis shows log2FoldChange (LFC). Y-axis shows the –log10 of the adjusted p-value (padj) as calculated by DESeq2. Genes downregulated in the KO are shown in red and genes upregulated are shown in blue defined by padj <1e-10 and LFC > 1.
h) Genome tracks of ChIP-seq for H2BK120Ub at the Foxp3 locus in wild-type (WT), Usp22 KO, non-targeting control (NTC-RNP) treated, Usp22-RNP treated and Rnf20-RNP treated Tregs. Evolutionary conservation, ATAC-seq, and ChIP-Seq for H3K27ac, H3K4me3, and H3K4me in WT Tregs are also shown.
i) Analysis of reciprocal regulation of Foxp3 by deubiquitinase Usp22 and E3 ubiquitin ligase Rnf20. Foxp3 MFI of Tregs sorted from Usp22+/+Foxp3YFP-Cre WT or Usp22fl/flFoxp3YFP-Cre KO mice and then electroporated with either NT control (NTC-RNP) or Rnf20 RNP.
j) Western blot analysis of H2BK120Ub (H2B-ub) levels in Tregs sorted from Usp22+/+Foxp3YFP-Cre WT or Usp22fl/flFoxp3YFP-Cre KO mice and then electroporated with either NT control (NTC-RNP) or Rnf20 RNP; corresponding to panel i. p84 was used as a loading control. Source data can be found in Supplementary Figure 1.
All data are presented as mean ±SEM. ns indicates no significant difference, *P < 0.05, **P < 0.01, ***P < 0.001, ****P < 0.0001. The exact sample sizes (n), p-values, statistical tests and number of times the experiment was replicated can be found in the “Statistics and Reproducibility” section.
