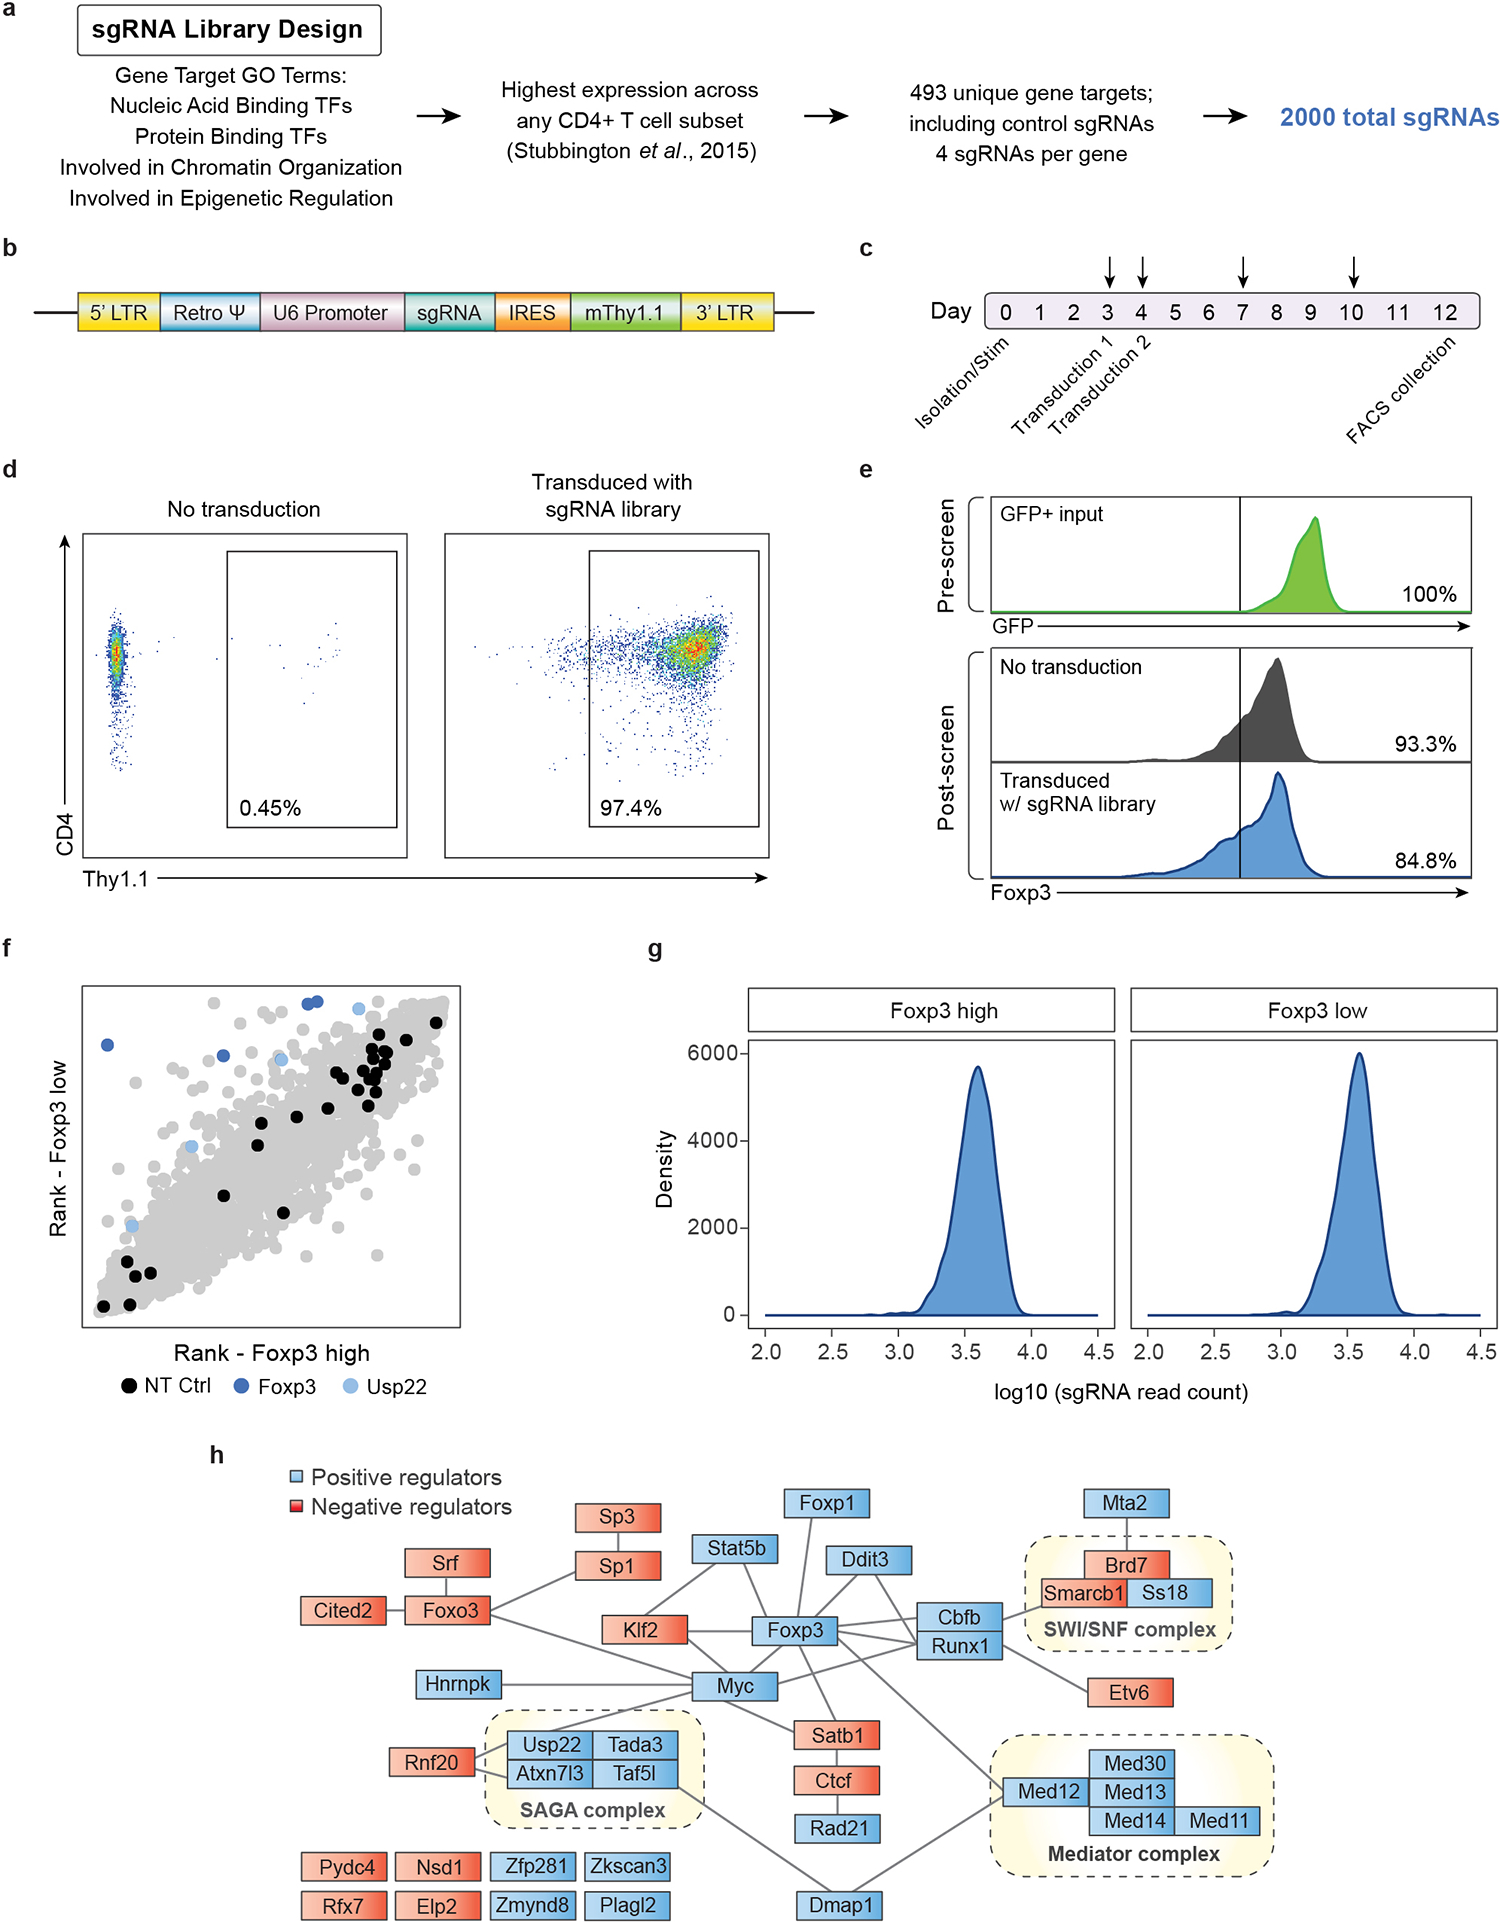
Extended Data Fig. 1. Design and Quality Control of Targeted Pooled CRISPR Screen in Primary Mouse Tregs.

a) Design strategy for selection of genes for unbiased targeted library of 493 targets, including 490 nuclear factors and 3 control targets (NT, GFP, and RFP). Genes were selected based on gene ontology (GO) annotation and then sub-selected based on highest expression across any CD4 T cell subset for a total of 2,000 sgRNAs.
b) Diagram of MSCV expression vector with Thy1.1 reporter used for retroviral transduction of the sgRNA library.
c) Detailed timeline schematic of the 12-day targeted screen pipeline. Arrows indicate when the cells were split, and media was replenished.
d) Retroviral transduction efficiency of the targeted library in primary mouse Tregs shown by Thy1.1 surface expression measured by flow cytometry. The infection was scaled to achieve a high efficiency multiplicity of infection.
e) Foxp3 expression from screen input, output and control cells measured by flow cytometry. Top: Foxp3 expression from input Foxp3+ purified Tregs as measured by GFP expression on Day 0. Middle: Foxp3 expression as measured by endogenous intracellular staining from control Tregs (not transduced with library) on Day 12. Bottom: Foxp3 expression as measured by endogenous intracellular staining from screen Tregs (transduced with library) on Day 12.
f) Targeted screen (2,000 guides) shows that sgRNAs targeting Foxp3 and Usp22 were enriched in Foxp3 low cells (blue). Non-targeting control (NT Ctrl) sgRNAs were evenly distributed across the cell populations (black).
g) Distribution of read counts after next generation sequencing of sgRNAs of sorted cell populations, Foxp3high and Foxp3low.
h) Schematic of experimentally determined and predicted protein-protein interactions between top hits, 16 negative regulators (red) and 25 positive regulators (red), generated by STRING-db34. Black lines connect interacting proteins and dotted lines outline selected known protein complexes.
All data are presented as mean ±SEM. ns indicates no significant difference, *P < 0.05, **P < 0.01, ***P < 0.001, ****P < 0.0001. The exact sample sizes (n), p-values, statistical tests and number of times the experiment was replicated can be found in the “Statistics and Reproducibility” section.
