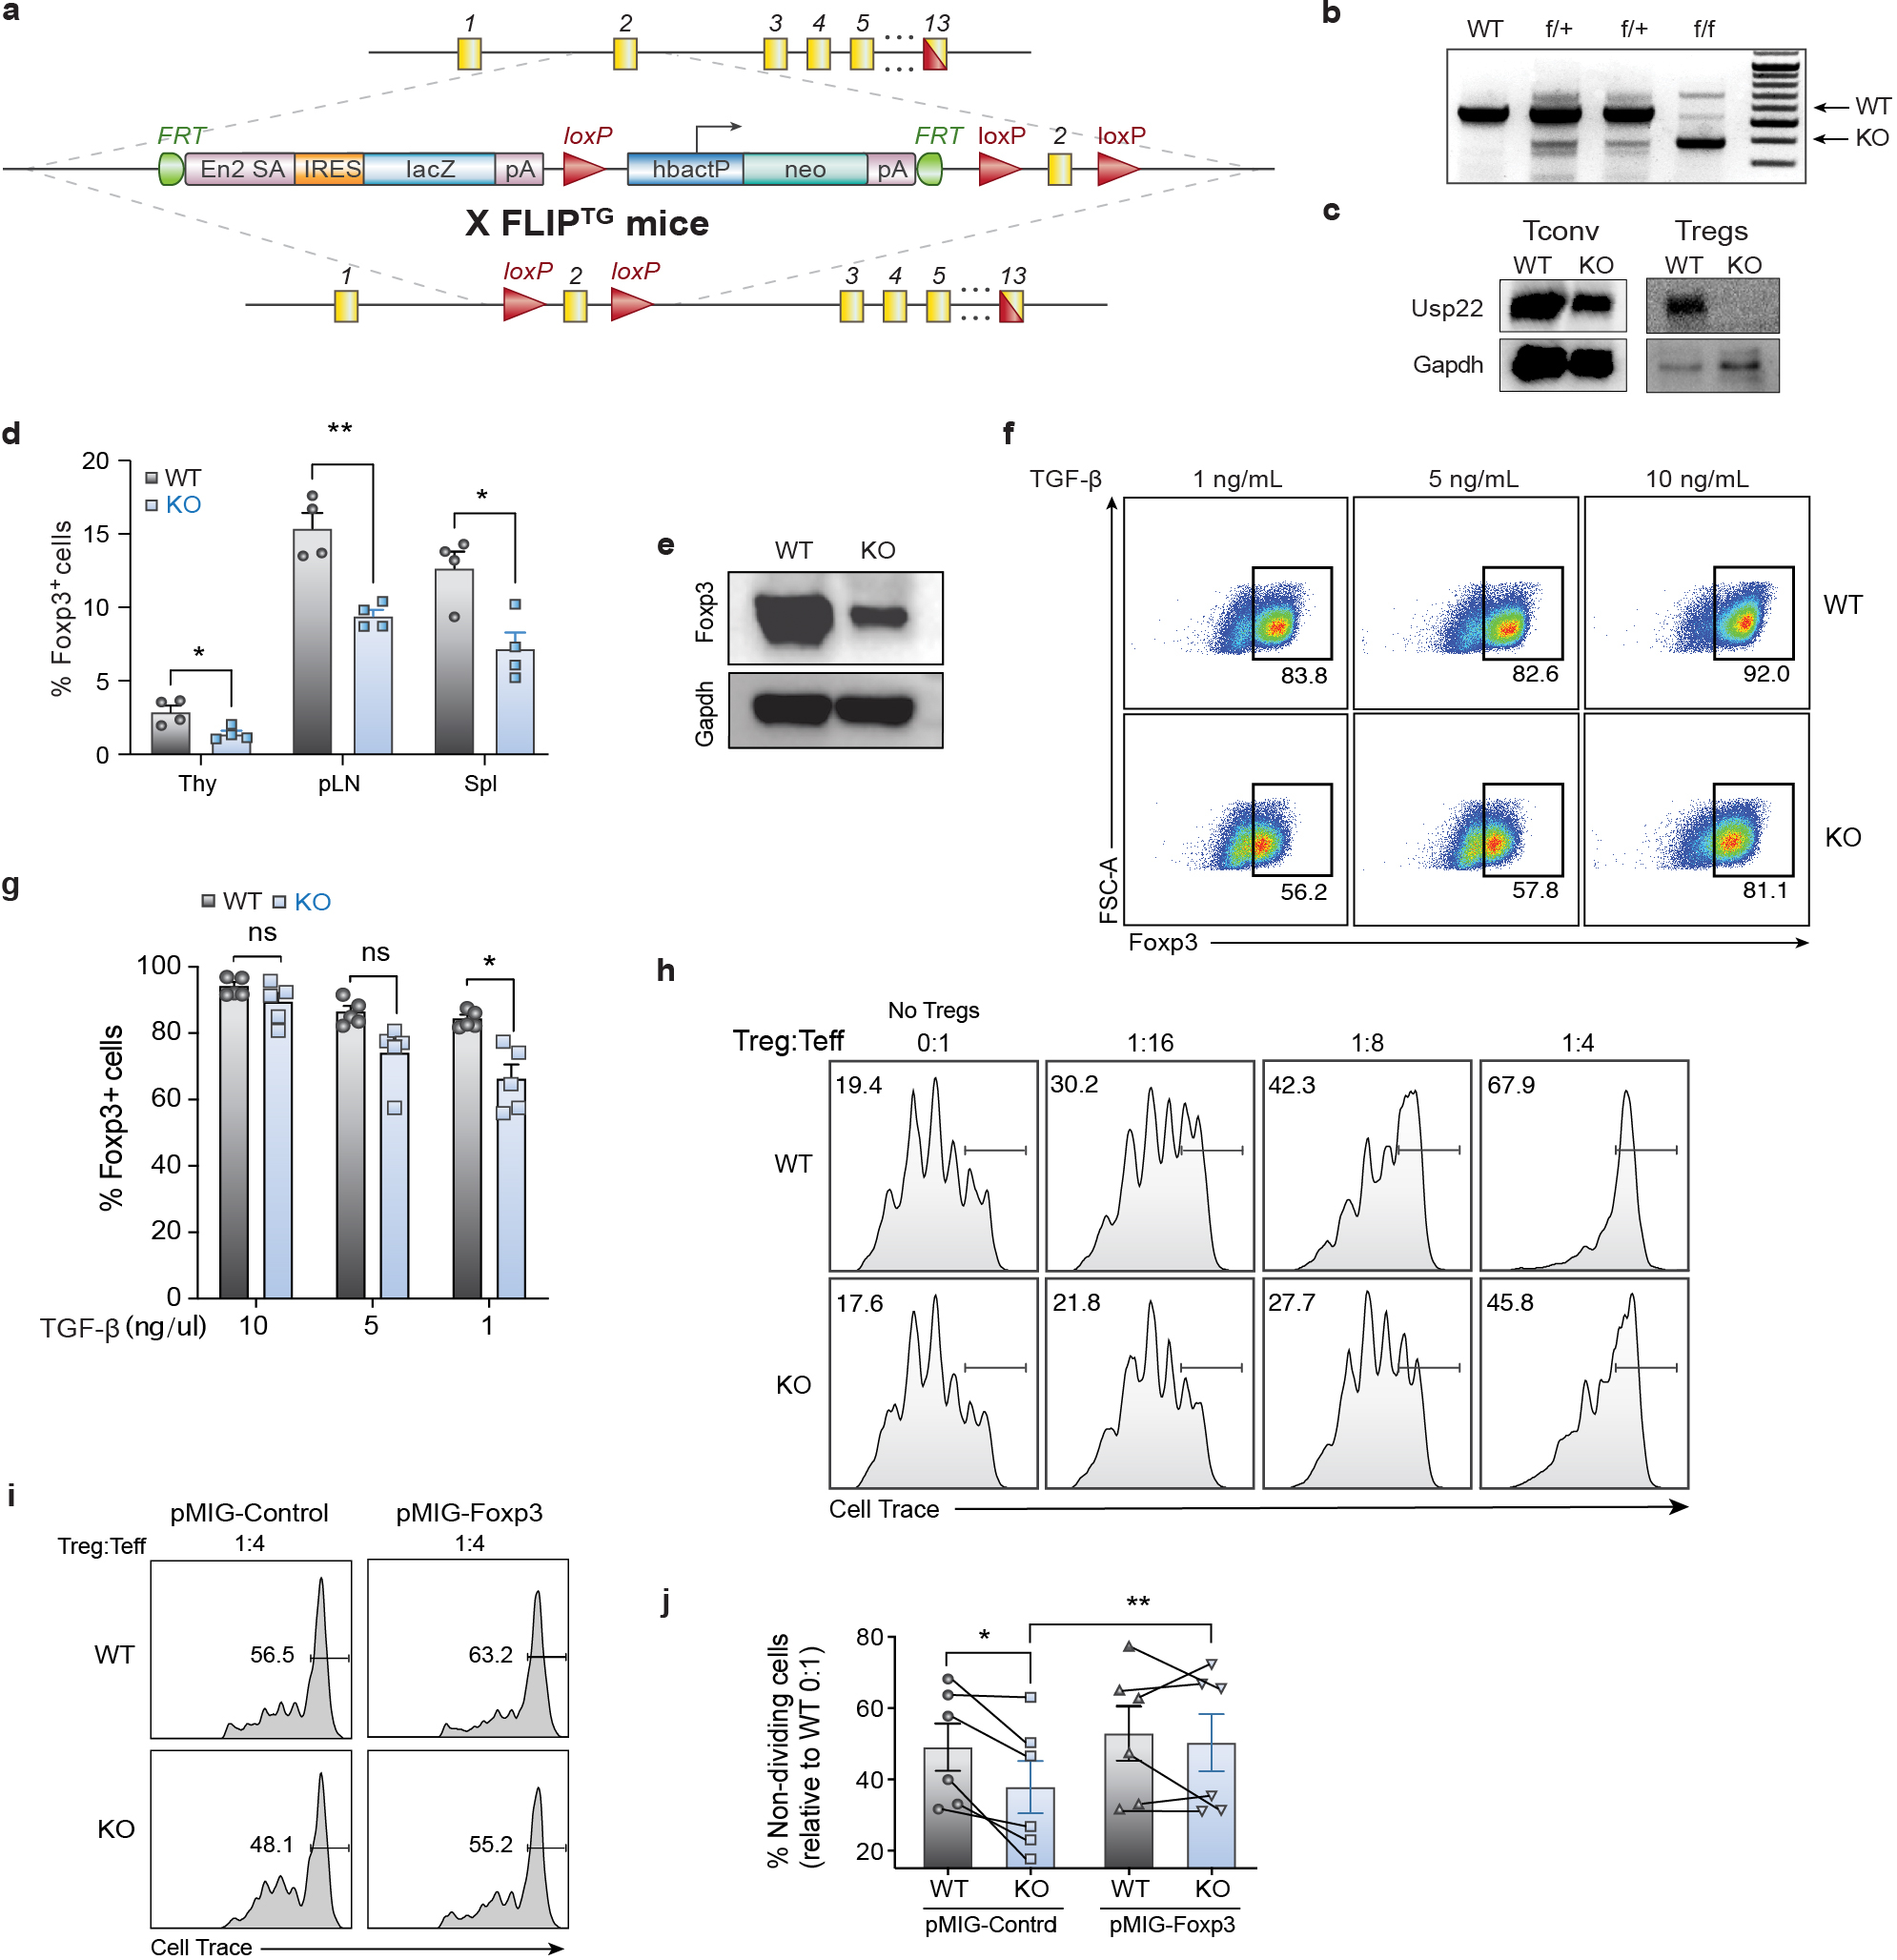
Extended Data Fig. 3. Design and Validation of Treg-specific Usp22 Knockout Mice.

a) Diagram of the murine Usp22 locus. Targeting vector contains IRES-lacZ and a neo cassette inserted into exon 2.
b) Genotyping by PCR showed a 600-bp band for the wild-type allele and a 400-bp band for mutant allele, simultaneously in the homozygous floxed (f/f) mice.
c) Western blot analysis of Usp22 in CD4+CD25− conventional T cells (Tconv) and CD4+CD25+ Treg cells isolated from Usp22+/+Foxp3YFP-Cre WT and Usp22fl/flFoxp3YFP-Cre KO mice. Gapdh was used as a loading control.
d) Statistical analysis of CD4+Foxp3+ Treg frequencies, corresponding to Figure 2c.
e) Western blot analysis of Foxp3 protein level from Tregs isolated from spleen and LN of Usp22+/+Foxp3YFP-Cre WT or Usp22fl/flFoxp3YFP-Cre KO mice. Gapdh was used as a loading control.
f) iTreg differentiation of naïve CD4+ T cells from Usp22+/+Foxp3YFP-Cre WT or Usp22fl/flFoxp3YFP-Cre KO mice with titration of TGF-β (as indicated).
g) Summary of iTreg differentiation of naïve CD4+ T cells from Usp22+/+Foxp3YFP-Cre WT or Usp22fl/flFoxp3YFP-Cre KO mice with titration of TGF-β (as indicated).
h) In vitro suppressive activity of Tregs assessed by the division of naïve CD4+CD25− T cells. Naïve T cells were labeled with cytosolic cell proliferation dye and activated by anti-CD3 and antigen presenting cells (irradiated splenocytes from wild-type mice, depleted of CD3+ T cells), then co-cultured at various ratios (as indicated above) with YFP+ Treg cells sorted from 8-week-old Usp22+/+Foxp3YFP-Cre WT or Usp22fl/flFoxp3YFP-Cre KO mice. Numbers indicate the percentage of non-dividing cells for each ratio.
i) In vitro suppressive activity of control (pMIG-Control) or Foxp3+ (pMIG-Foxp3) transduced YFP+ Tregs sorted from Usp22+/+Foxp3YFP-Cre WT or Usp22fl/flFoxp3YFP-Cre KO mice. Naïve T cells were labeled with cytosolic cell proliferation dye and activated then co-cultured at 1:4 transduced YFP+ Treg cells to naïve T effectors (Teff). Numbers indicate the percentage of non-dividing cells for each ratio.
j) Summary data of in vitro suppression experiments represented as frequency of non-dividing cells relative to WT 0:1 No Treg control, corresponding to panel i. Lines connect paired samples.
All data are presented as mean ±SEM. ns indicates no significant difference, *P < 0.05, **P < 0.01, ***P < 0.001, ****P < 0.0001. The exact sample sizes (n), p-values, statistical tests and number of times the experiment was replicated can be found in the “Statistics and Reproducibility” section. Source data for gels and blots can be found in Supplementary Figure 1.
