
Figure 1.
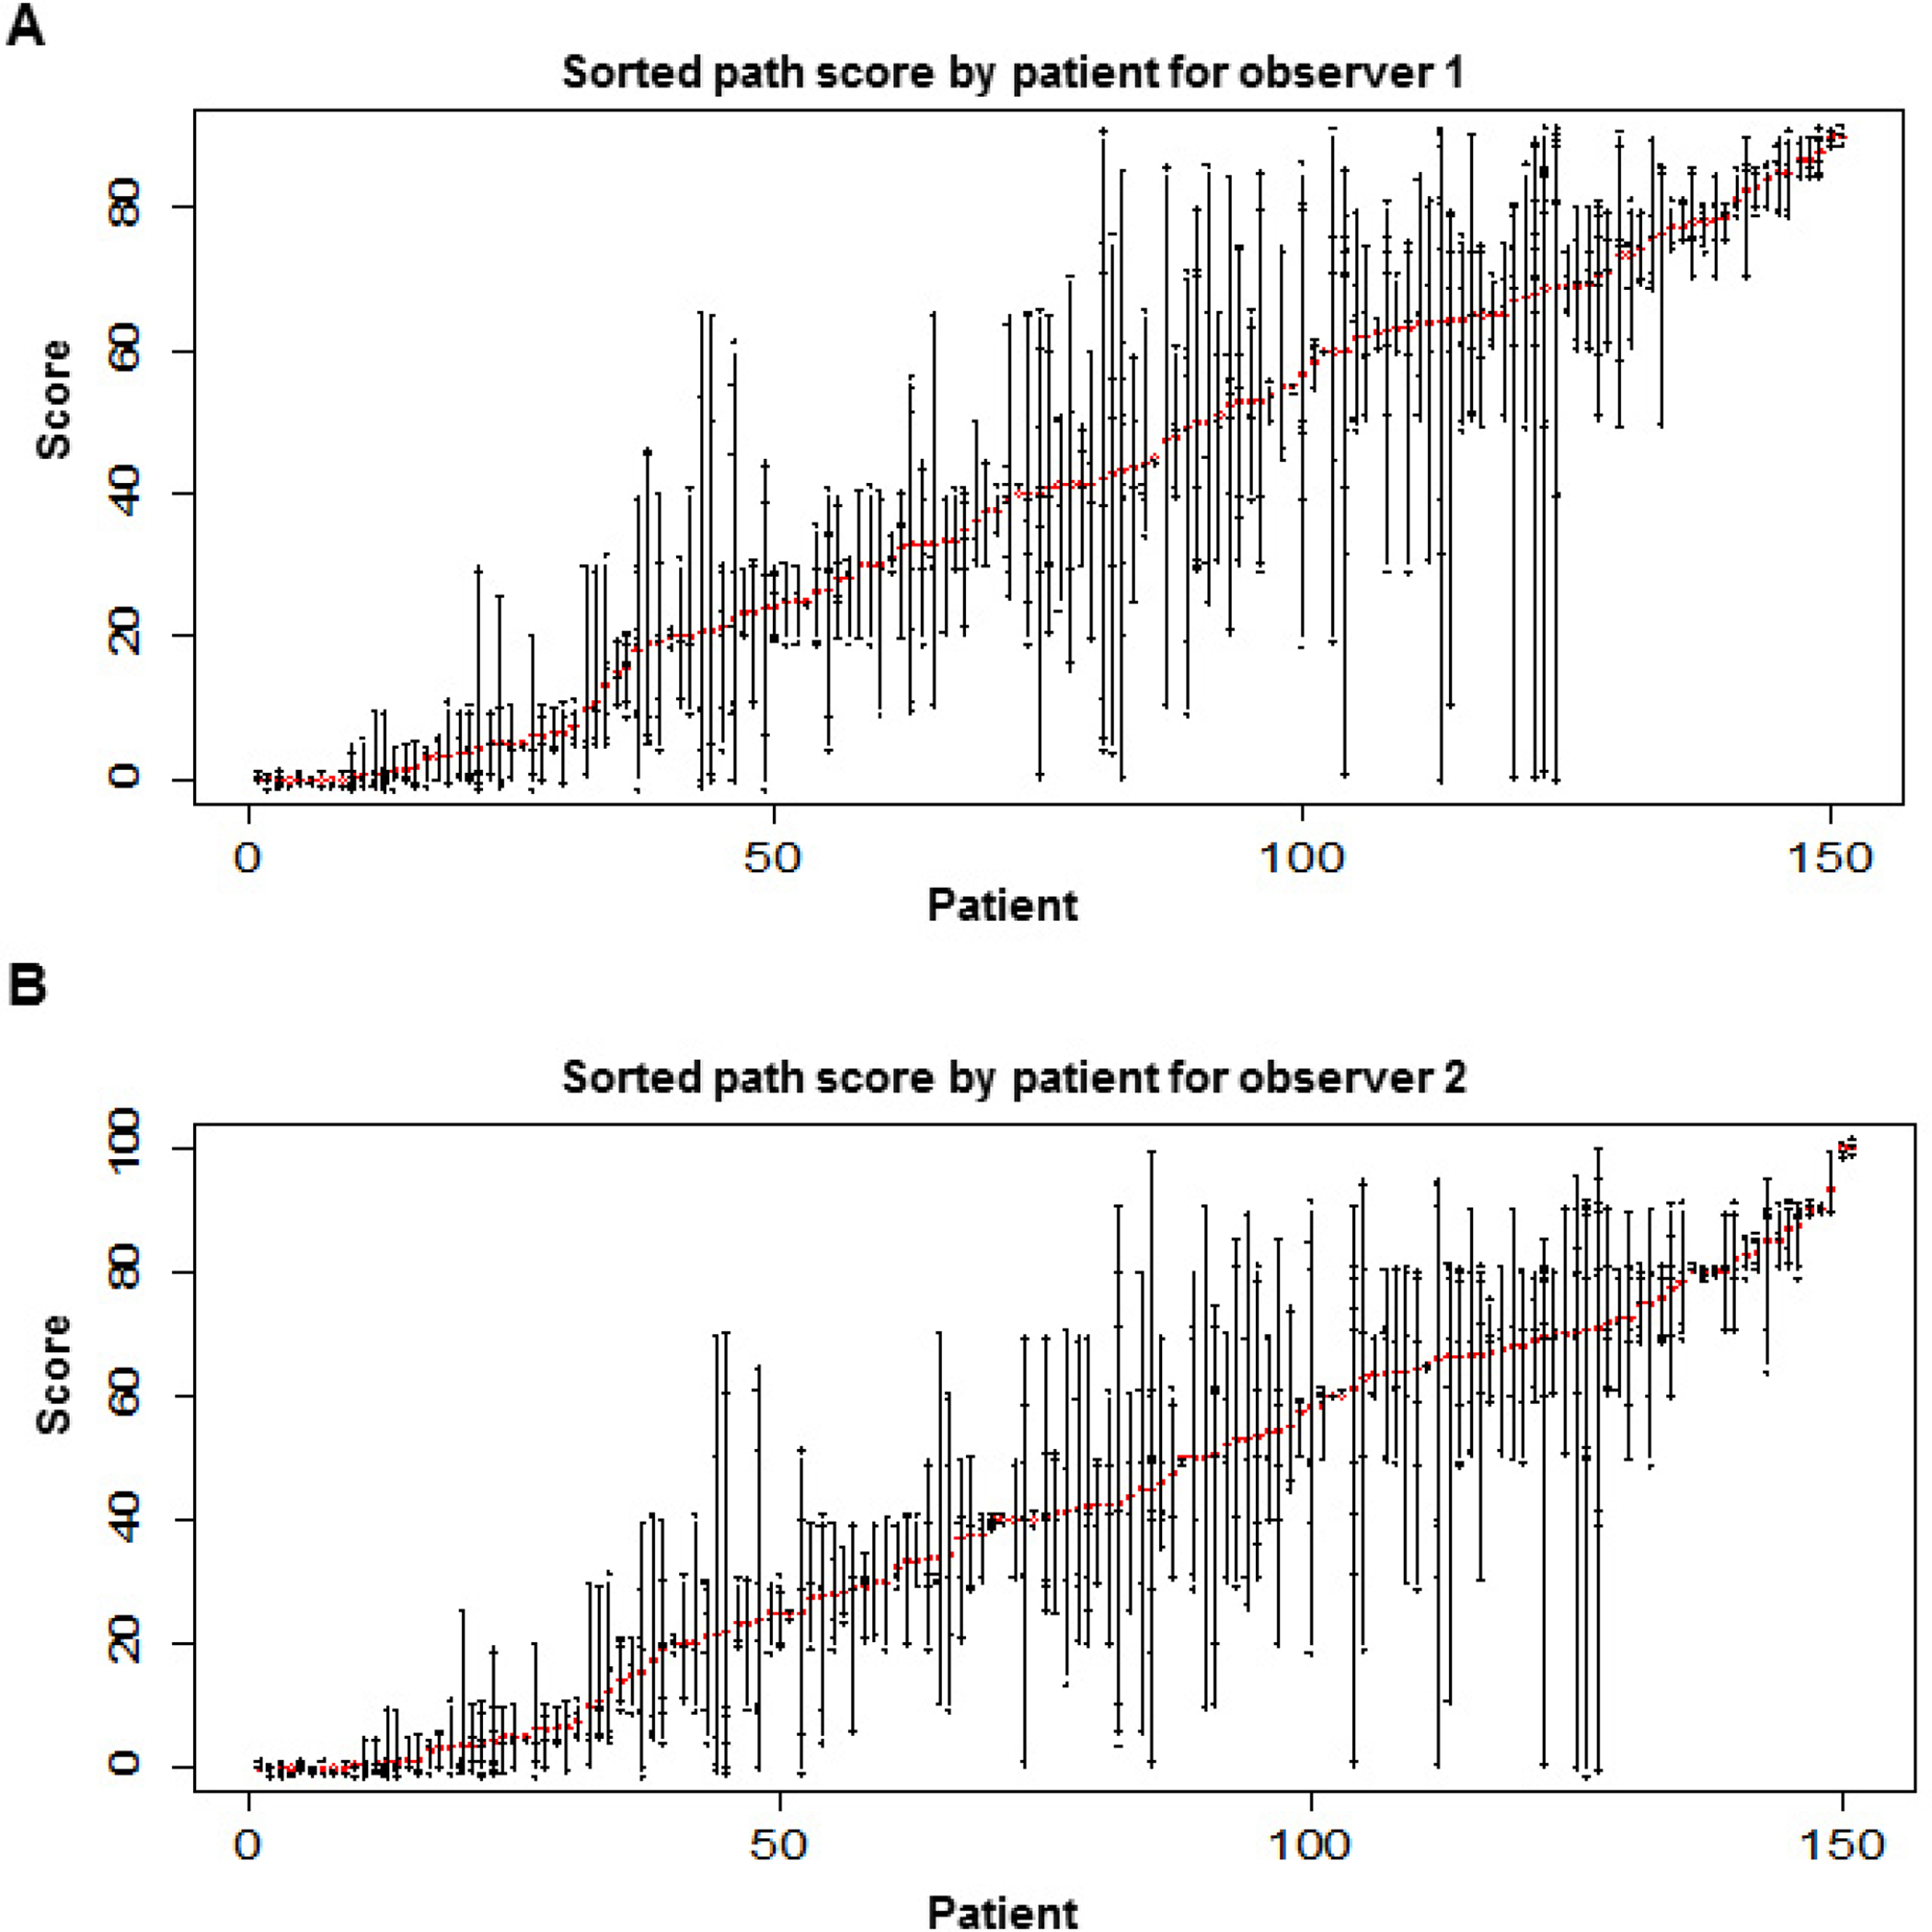
Score of the percentage of viable tumor cells, sorted by the ascending order of the mean score for each patient. The mean score is shown by the red circle. Each reading is marked by a ‘+’ sign. The scores were slightly jittered to break the ties. A and B show the results for observer 1 and observer 2, respectively.