
Figure 2.
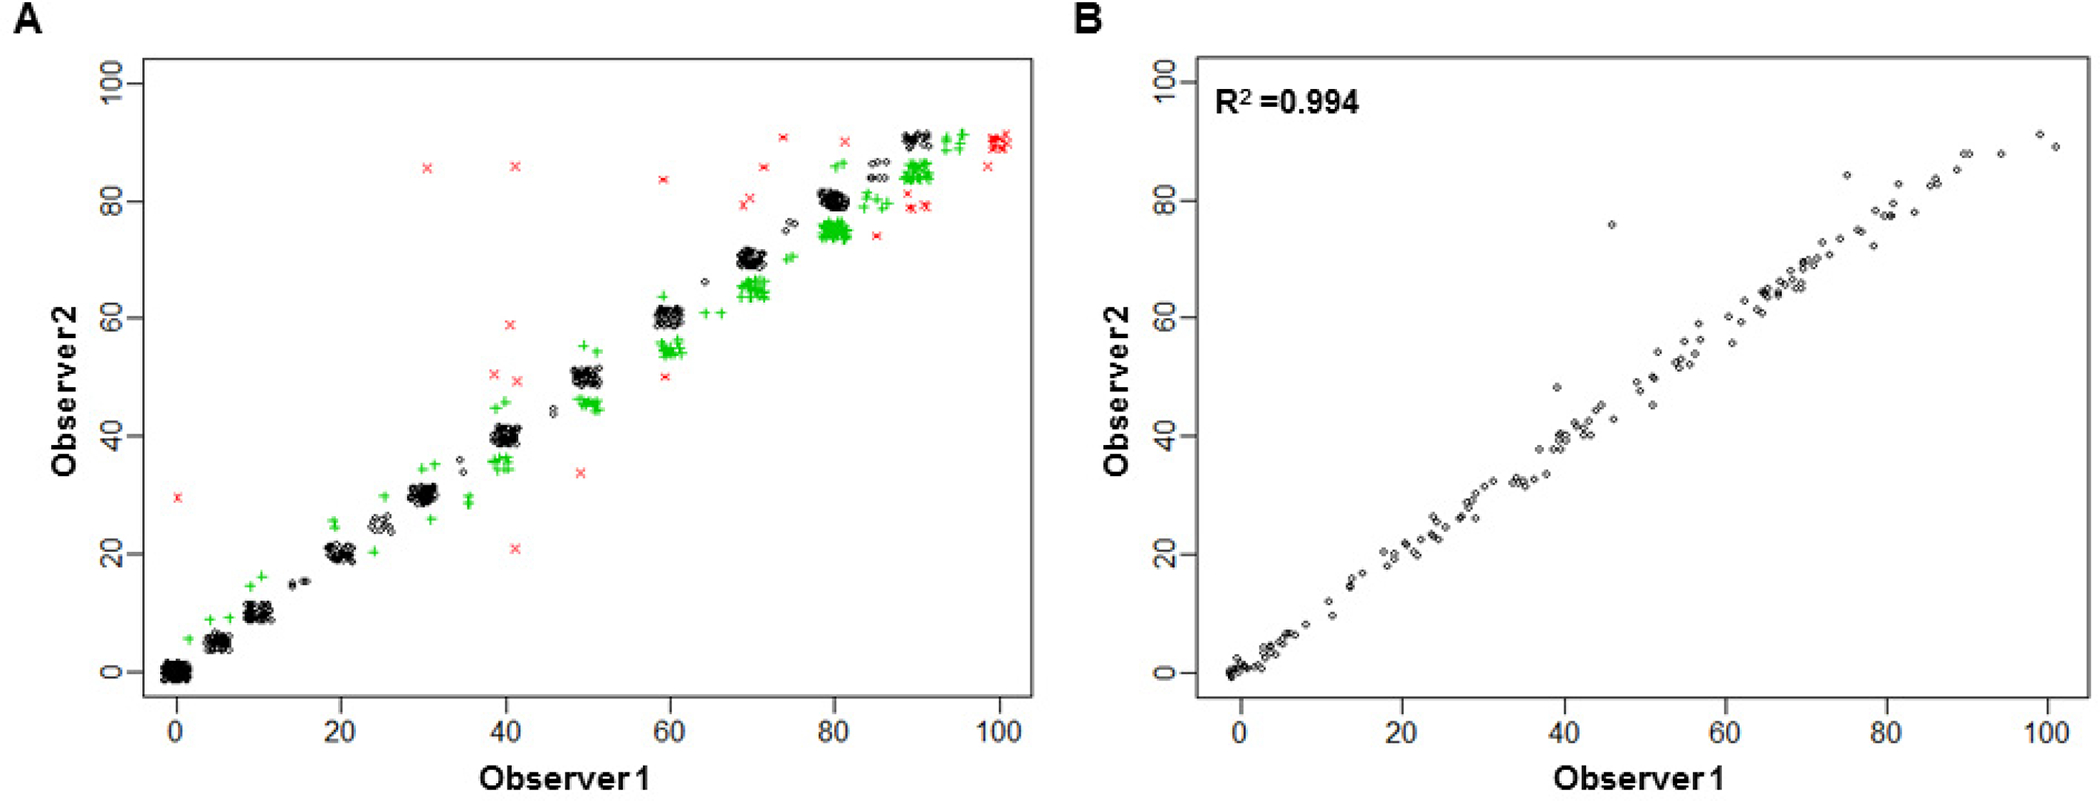
The percentage of viable tumor cells on each slide for individual patients, as examined by observers 1 and 2, for 151 patients. (A) Scatter plot of the score of the percentage of viable tumor cells for observer 1 versus observer 2 on all slides from all patients. The actual scores were jittered slightly to break the ties. Black circles show that the two scores are identical. Green “+” symbols show that the two scores differ by 5%. Red “x” symbols show that the two scores differ by 10% or more. (B) The statistical analysis indicated a significant correlation between observers 1 and 2.