
Figure 3.
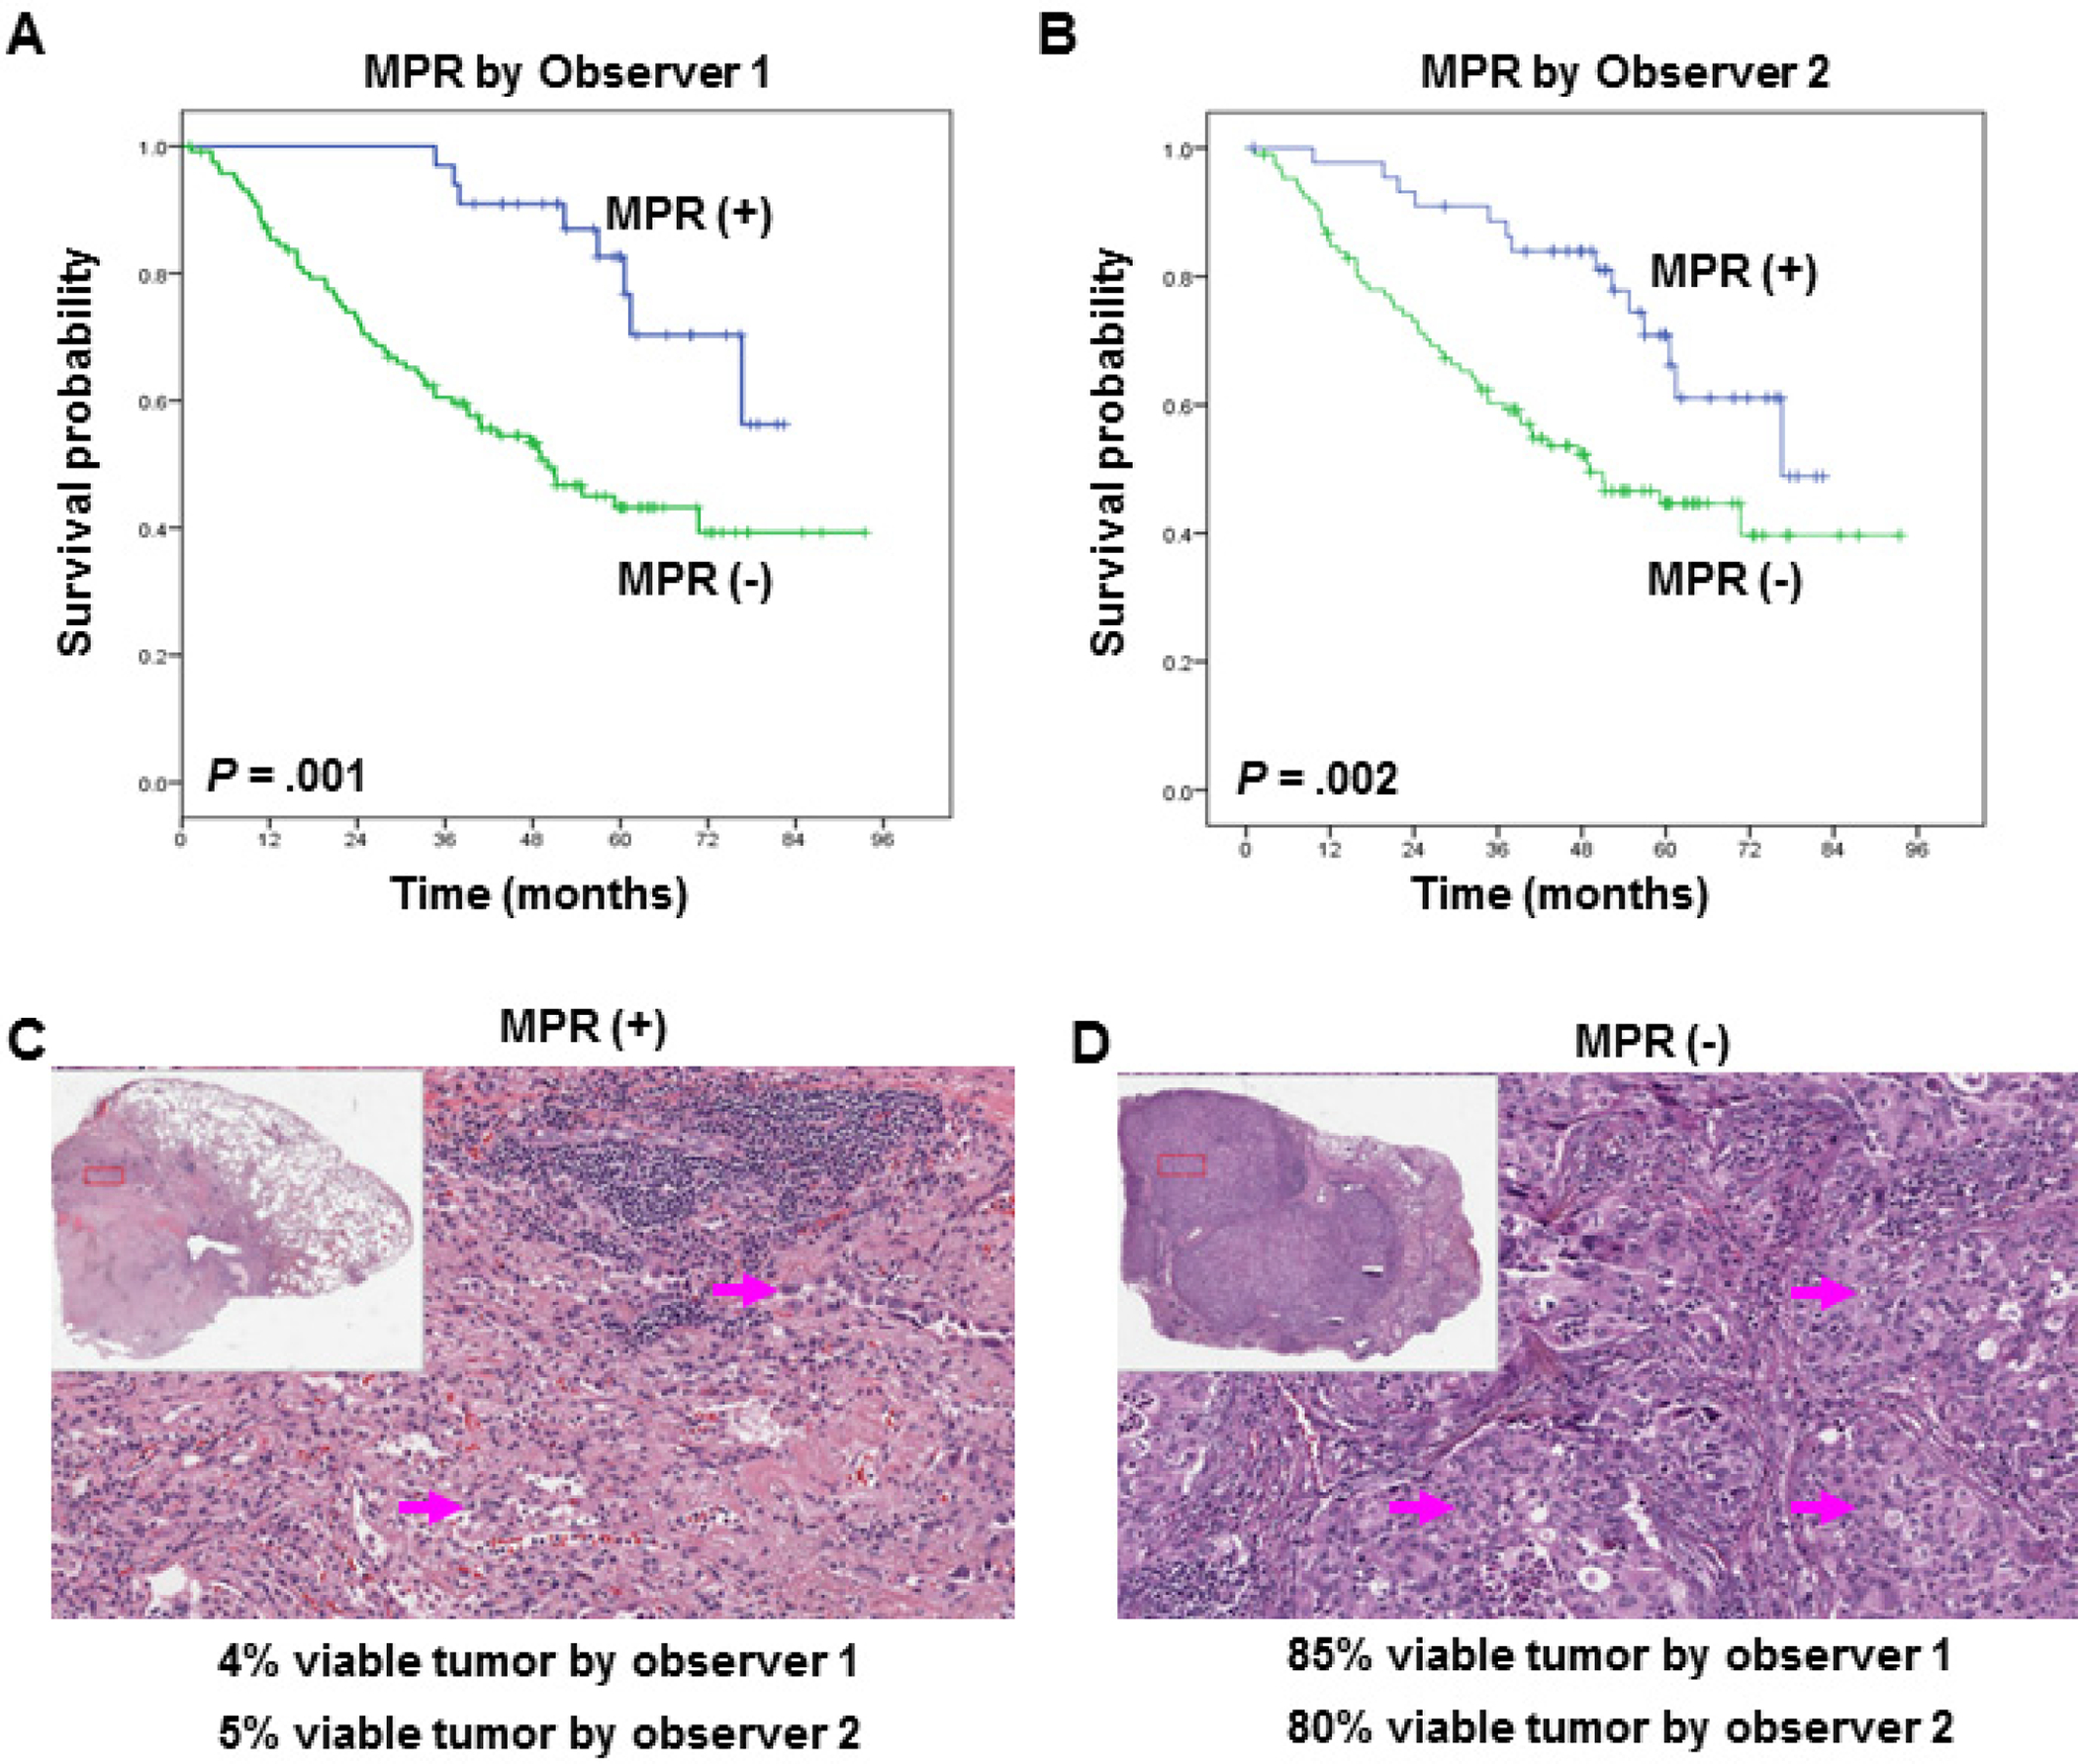
Kaplan-Meier estimates of overall survival on the basis of the percentage of viable tumor cells, as determined by observer 1 (A) and observer 2 (B). (A and B) Overall survival was significantly longer in patients with ≤10% viable tumor cells than in those with >10% viable tumor cells. Patients with ≤10% viable tumor cells are indicated by MPR (+), and patients with >10% viable tumor cells are indicated by MPR (−). Representative examples are shown of the histopathological features of tumors associated with extensive response to treatment (C) or no response to treatment (D) and of the percentage of viable tumor cells for individual patients, as determined by observers 1 and 2. Arrows indicate viable tumor cells.