Figure 4.

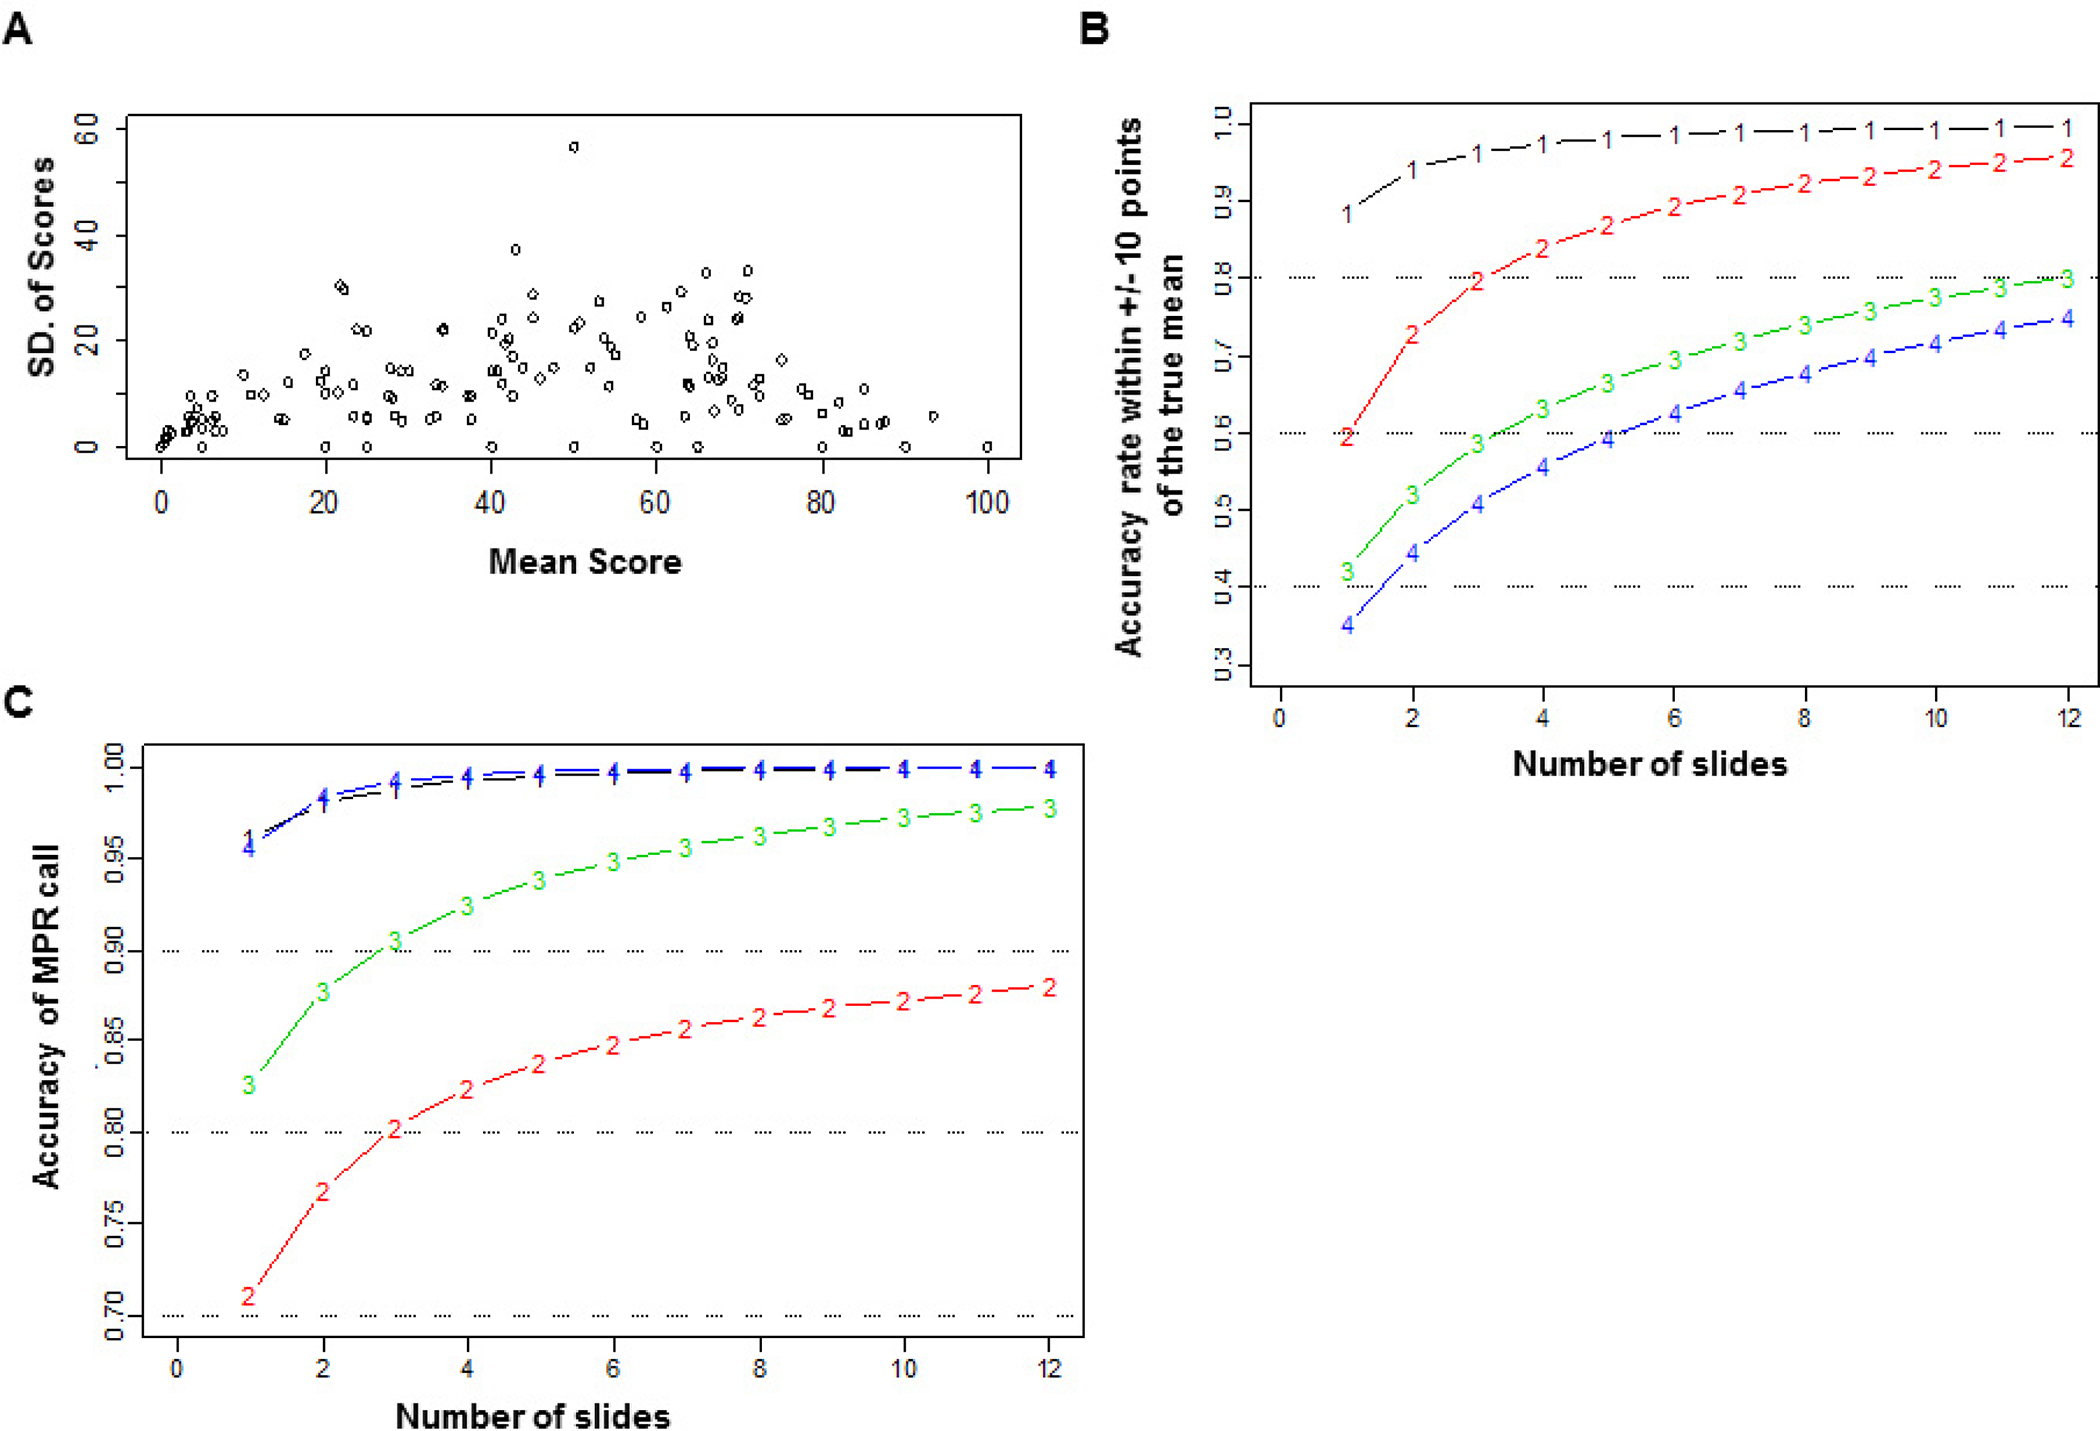
Statistical analysis of pathological readings of multiple slides. (A) Standard deviation versus mean score for all patients. (B) Accuracy of estimating the mean percentage of viable tumor cells within 10% of the true mean by the number of slides read, coded by the true mean group. Group 1 = true mean, 0–5; group 2 = 6–15; group 3 = 16–25; and group 4 = 36–55. (C) Accuracy of major pathological response (MPR) by the number of slides read, coded by the true mean group. Group 1 = true mean, 0–5; group 2 = 6–15; group 3 = 16–25; and group 4 = 36–55.
